
A novel on high voltage gain boost converter with cuckoo search optimization based MPPTController for solar PV … – Nature.com
Abstract
Traditionally, isolated and non-isolated boost converters are used for solar photovoltaic systems (SPV). These converters have limitations such as low voltage gain, less voltage ripples, temperature dependence, high voltage stress across the switches, and being bulky in size. Besides, the solar PV system also has non-linear characteristics between I–V and P–V, and the energy yield potential is affected by partial shading phenomena. Therefore, maximum power point tracking (MPPT) is being added to the SPV system to get the maximum output power under steady and dynamic climate conditions. Although the conventional MPPT has drawbacks such as less accuracy in predicting the MPP under partial shading conditions, low tracking speed, and more ripples, Hence, the research proposes a stackable single switch boost converter (SSBC) with a Cuckoo search MPPT controller for the SPV system. The efficiency of the proposed circuit topology has been compared with conventional boost converters with various MPPTs. Subsequently, the accuracy of tracking true MPPT by CSO is compared with that of PSO and FPNA. The results show, that the CMPPT with CBC has produced more ripples, whereas the BMPPT with SSBC produces ripple-free power under steady conditions. It is also observed that SSBC with BMPPT produces more power than SSBC with TMPPT. The efficiency of SSBC with BMPPT is better than other combinations. Finally, a prototype model has been developed and verified.
Introduction
Due to urbanization, industrialization, and long-term changes in people’s social and economic status, the need for electricity has grown quickly around the world. Because of this, the power industry is adding to its ability to make power through a program called capacity addition 1,2,3,4,5. The growth rate of power generation is shown in Fig. 1. Traditional power plants use fossil fuels such as coal, petrol, and diesel as a primary resource for generating electrical energy 6. India’s government says that 60% of the country’s electricity comes from thermal power plants. It includes 52.6% from coal-based power plants, 1.7% from lignite, 6.5% from gas, and 0.1% from diesel, where the remaining 40 percent were obtained from Renewable Energy Resources (RER), respectively. Conventional power plants have problems like not having enough resources, fuel prices that change often, and putting harmful gases into the air. So, RER is playing a significant role in electrical energy generation 7,8,9.
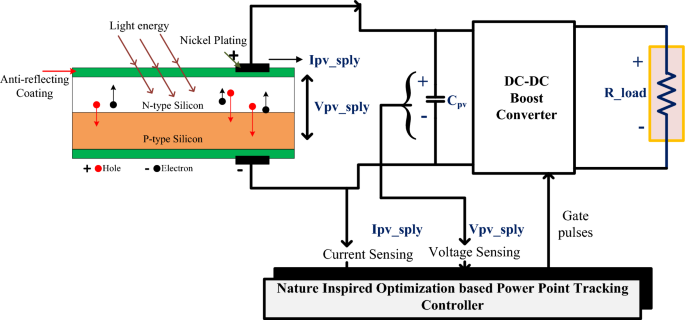
RER is solar, wind, hydro, tidal, etc. 10. By using suitable conversion technology, electrical energy is extracted from RER. For example, wind power plants convert kinetic energy into electrical energy by using blades. Whenever air interacts with blades, it results in rotation, which means that it generates kinetic energy. This kinetic energy is used to rotate the turbine. It is connected to the wind generator, so it uses the induction principle to make electricity. The method has some problems, such as a high initial cost, hard maintenance, and a need for more land. In addition, it creates power quality issues on the grid 11,12,13,14,15. So, the compensating equipment, which costs more, is needed to make sure that the power quality is right. However, India occupies the fourth place for harnessing electrical energy from wind power plants. The total installed capacity in India is 38.789 GW 16.Solar power plants are also growing at a slow rate because the cost of the SPV cell is going down slowly but surely every day. PV power generation is based on the photovoltaic effect. SPV is made of P-type semiconducting materials sandwiching N-type semiconductor materials. P-type semiconductor materials have fewer electrons than N-type semiconductor materials. When the sun shines on the solar cell, the electrons in the N-type material become energized, causing the N layer to move toward the player, as shown in Fig. 1. The current created by the photovoltaic effect is collected by connecting a load across the P-type and N-type semiconductor materials 17.
A single PV cell can generate up to 0.7 V, which is not enough to drive the load 18. As a result, the number of PV cells is connected in series to form the solar cell strings. Then, the number of cell strings is connected to form the module. The number of modules is connected to form the string. This process significantly increases the incident area of solar irradiation, known as the catchment area, so that the power generation capacity of SPV is increased 19. There are currently three types of SPV cell technologies in use: mono, poly, and thin film. Among them, monocrystalline is more costly than others. Monocrystalline, on the other hand, has efficiency comparable to all others. Furthermore, monocrystalline PV requires less space than others to generate a specific wattage. But cost-wise, polycrystalline is preferable to others 20,21,22,23,24,25.The SPV energy yield potential depends a lot on the amount of light, the temperature of the cell, and the weather. The SPV was unable to produce constant power the whole day. Because the amount of available irradiation in the Earth’s atmosphere varies over time, the relation between the voltage and current is non-linear, so extracting maximum power from SPV is a crucial task.
Hence, a new technology called MPPT is incorporated with the SPV system for extracting maximum power. The role of MPPT is to track the maximum power point and keep the SPV working on that particular point. Meanwhile, the MPP point also changes with time; therefore, MPPT continuously tracks the MPP based on the present and past measurements 26. All MPPT techniques track the MPP by using present and previous power quantity measurements. The methodology to be used has been a key parameter for tracking the MPP 27,28,29.Moreover, conventional MPPT can track the MPP under steady climatic conditions. When the climate changes quickly, conventional MPPT can’t find the MPP because there are so many peaks at the same time. Therefore, accurate MPPT techniques are required to track the MPP. MPPT is the subject of numerous studies. Traditional boost converters have low voltage gain and high voltage stress across switches. Also, the problem of diode reverse recovery voltage is made worse by the fact that a high-duty cycle is needed to get a high voltage gain 30.
Isolated and non-isolated converters are the two broad categories of converters 31. Isolated boost converters achieve high voltage by varying the turn ratio of the transformers. Isolated DC-DC converters have limitations such as low efficiency, low immunity to electromagnetic interference, a larger size, and a higher peak voltage that can damage other electronic components used in the converter 32,33,34,35. While non-isolated converters are smaller in size, have a simpler structure, and are less expensive, the voltage gain ratio is very low. It can be overcome by interleaved boost converters.Nevertheless, it produced current ripples and high voltage stress across the switches. So, cascade converters are made to improve the ratio of voltage conversion, but they need more power electronics parts, which makes the circuit more complicated and increases current ripples. 36. So, the research work suggests a DC-to-DC boost converter with a single switch that can be stacked to improve the voltage level of the boost converter. The cuckoo search MPPT is used to change the duty cycle of the proposed boost converter. Then, the results are compared to those of traditional boost converters with traditional MPPT controllers. Also, a comparison was made between CS MPPT with SCB and SCB with bio-inspired MPPT controllers.
Advanced adaptive Cuckoo search algorithm
The Cuckoo Search Algorithm is a meta-heuristic algorithm. The Cuckoo search algorithm was inspired by the fact that some species lay their eggs in the nests of other birds for increased survival 37. Let’s say that the host bird finds the egg of the other bird in its net. Both the egg and the net would be destroyed, and new nets would be built in other places. From a mathematical point of view, each egg in the net is called a solution 38. The probability of the survival of a cuckoo bird’s egg is possible when its appearance is similar to that of the host bird. Perhaps the worst solution is when the cuckoo bird egg is identified by the host bird 39. The algorithm is developed by the following three key conditions: At first, a cuckoo lays one egg, which is randomly placed in the host bird’s nest. The eggs are called solution, and they are stored in the host nest. Moreover, an egg in the nest is called a set of solutions, whereas a cuckoo egg is called a new solution. The next generation is possible with a high-quality egg and the best nest. This high-quality egg is referred to as the best solution because it is close to the best value 40. It can replace the less-fitting solutions. Finally, the number of hosts is not variable. Mathematically, the population is defined as the number of host nests, whereas the number of host birds that find the egg is defined as the worst solution 41,42,43,44.
The cuckoo bird is used to test the flight method to find the best solution or a new solution that is better than the previous one 45. There are three ways to find the best solution for the levy flight: walking, running, or a random walk. The first term represents moving at a regular pace by lifting and setting down each foot in turn and never having both feet at ground level. The run represents a faster speed than the walk. Random walking is a mix of step-by-step walking in different directions. Whereby the cuckoo search algorithm is based on the random walk search process, respectively. At first, the cuckoo bird uses a pattern called smaller steps followed by larger steps to figure out where the best place is to lay an egg 46. The cuckoo bird is finding a suitable net, as described by the Levy flight. According to the power law, the step size of Levy’s flight is estimated because Levy’s flight is used in a random walk to find the nest (refer to Eq. (1)).
The flow chart of the Cuckoo Search Algorithm is depicted in Fig. 2. First, you need to set up the parameters, like the number of host nests (n), the chance that the host bird will find the cuckoo egg (Pa), and the maximum number of iterations (Max). Subsequently, check whether the number of iterations is less than the maximum number 47. If the condition is true, the levied flight search method is used to come up with a new solution, and the fitness is then checked. Hence, a new nest is searched randomly for the next solution. Once again, the fitness of the host egg is compared to the fitness of the cuckoo egg; assume that the cuckoo egg is healthier than the host egg and that the cuckoo egg replaces the host egg. Whereas the host egg fitness value is higher, the cuckoo egg solution is the worst. So, the cuckoo egg is thrown away from the nest, which generates a new solution by using Levy flight 48.
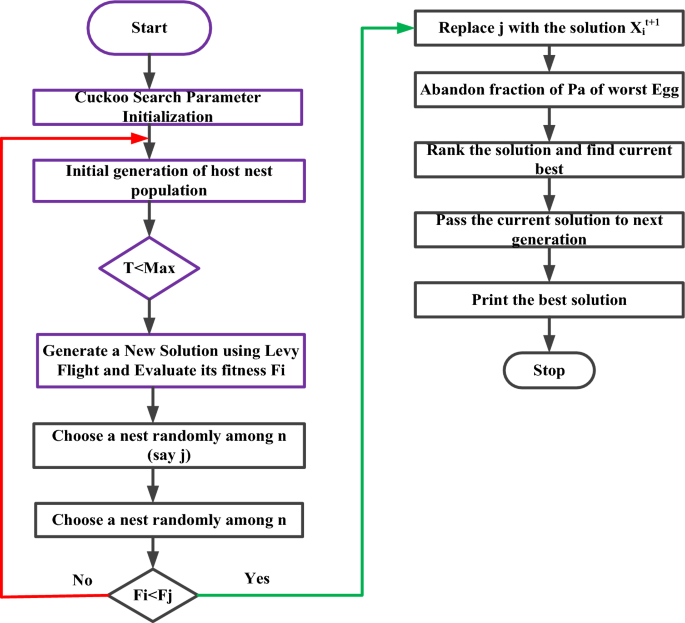
Working flow of the cuckoo search algorithm.
The current solution is ranked at each iteration until the stopping condition is met. When you use Levy flight search, you get a new solution, which can be written as the following Eq. (1). Where K values are 1, 2, and 3. The total number of samples is denoted by n. The following variable is step size, which is represented by the fitness function, which depends on the photovoltaic voltage, and shows how much power can be made 49. At first, samples are made and put on the solar panels that will later power us. This sets the first fitness value. The voltage value that produces the most power determines the best sample. Later, new voltage samples are made using the Levy flight search method, which is shown in the following Fig. 3.
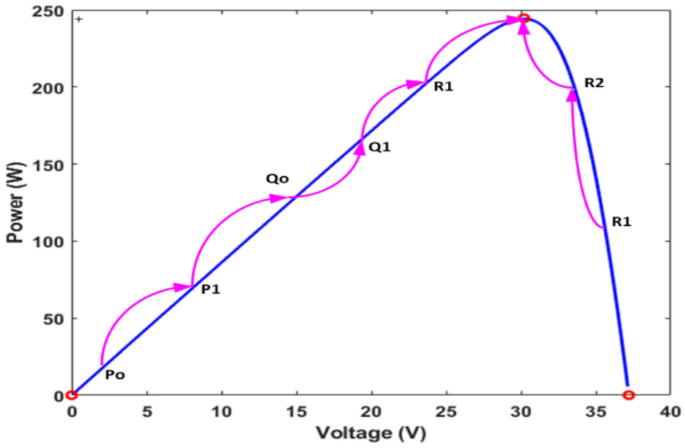
Power point tracking of solar PV by using CSA.
CSO tracking of GMPP under steady and dynamic conditions is clearly shown in Fig. 3. The relationship between voltage and current in Fig. 3 shows the relationship between voltage and current without the partial shading effect of solar PV.Several samples are distributed over the PV curve, which is called the number of samples. When the number of samples isincreased the accuracy of MPP tracking is improved. When the number of samples isincreased, the search efficiency improves, but the convergence speed slows 50. As a result, four samples, such as P, Q, and R, are considered; additionally, the upper subscript indicates that iterations 51. As a result, it is the best solution for this iteration. So, these two samples are forced to move toward the best solution point. Because of the Levy flight mechanism, CS has a larger step size to achieve the best solution. Furthermore, the step size varies with each iteration, as shown in Fig. 3. It is clear that Qo is the best solution for the first iteration results, and Po and Ro are resigning in favor of Qo 52.
On the other hand, the next iteration R1 achieves the best solution because true MPP is very close to R1. To reach the global MPP of the solar PV system, the CS algorithm follows the steps outlined above. For the first iteration results, it is clear that Qo is the best solution, and Po and Ro are resigning in favor of Qo; however, the net iteration R1 achieves the best solution because of true MPP. Before starting a new iteration, a validation is done to see if the samples have reached convergence. Suppose samples are converged to an MPP result; there is no further iteration 53. To estimate the power, all of the samples’ power quantities are measured. The samples with the highest power are referred to as the best samples 54,55,56,57,58,59,60. As a result, the remaining samples move in the direction of maximum power extraction from the solar PV systems. The step size is estimated by using the following Eq. (2).
The above Eq. (2) is used to find new solutions when it refers to the integral gamma function. If a sample gives less power than expected, it is ostensibly thrown out and a new one is made 61. These steps are repeated until the samples reach the MPP, which is the best place for them. When samples are found in the MPP results, the distance between them is zero, so all samples have the same value 62. This occurs only under a steady-state condition known as the “constant climate condition. But, practically, it’s not possible. In this case, samples are created with varying power ranges for various voltages. At this moment, samples are once again disseminated over the power versus voltage curve. The process will be repeated until the weather settles down, which will cause ripples in the amount of power that is put out 63. Also, it is necessary to study the limitations of the cuckoo search MPPT controller.
The cuckoo search optimization technique uses search steps with a cluster of long jumps and multiple short steps to get the best solution 64. This process reduces the efficiency of the cuckoo search algorithm. Because of the long jump, the path is diverted to reach the true maximum power point, such as the global power point. As per the algorithm, there are immediately smaller steps, which cause very low voltage changes in the PV module. During long-step processes, the change in the duty cycle is very large, and the second-step process change in the duty cycle is very small 65. Furthermore, the path these actions suggest may lead to further investigation of the region close by. As a result, numerous iterations are needed to get to the GMPP, and in the meantime, the load will experience poor power oscillation. The cuckoo search algorithm locates nests by using random numbers 66. On fewer occasions, the location of nests is not well distributed in these areas. It results in repeated iterations, which causes the local solution to trump the global solution 67.
Design and modelling of Boost DC-DC converters
Design and analysis of traditional boost converter
As shown in Fig. 4a, it is a common type of boost converter because it is as stable as others. It works in two modes, such as conducting, as shown in Fig. 4b, and blocking, as shown in Fig. 4c. In the first mode, the switch is on, which means it’s forward biased, so the diode is operating in reverse bias condition at a time interval of dTs. Results: There is no supply transfer from source to load. During the DTS time, the switch is open, which makes the diode biased in the forward direction and moves power from the source to the load 68,69,70. The duty cycle operations are shown in Fig. 5.
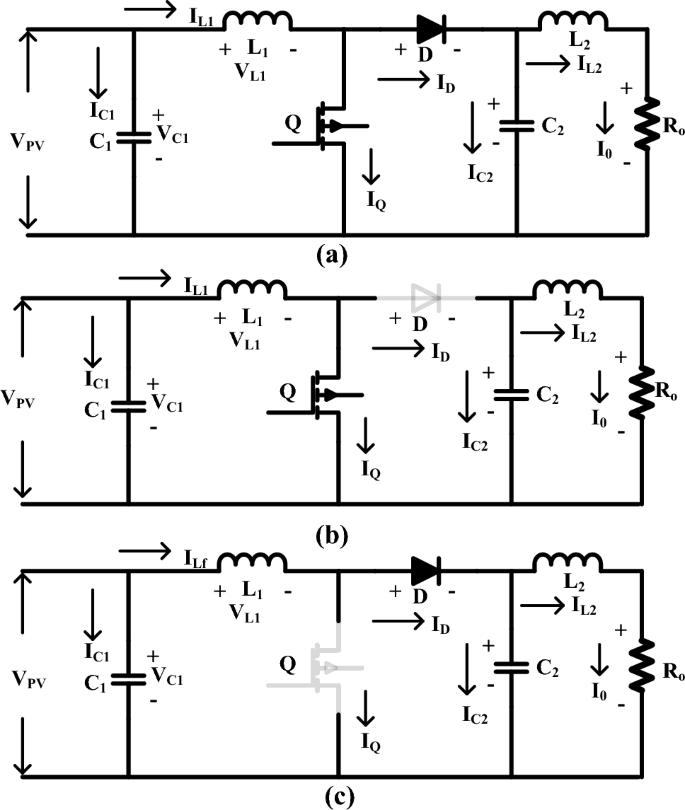
(a) Utilized converter structure, (b) Switching condition, and (c) OFF condition.
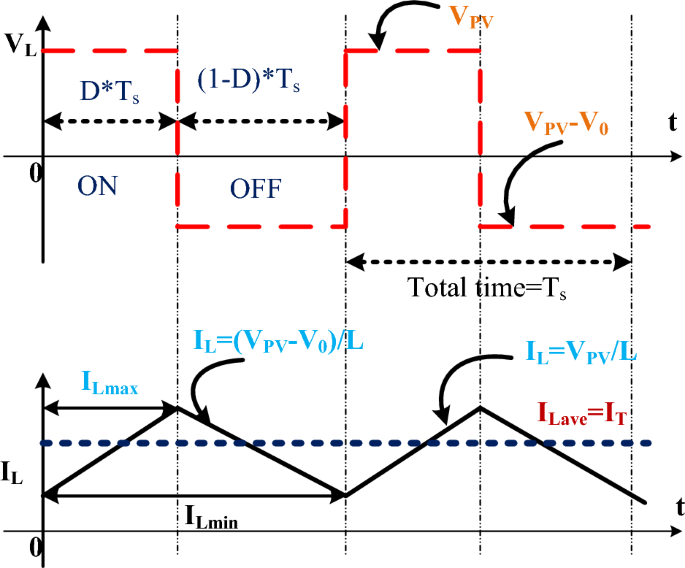
Boost converter duty cycle and inductor charging currents.
Equation estimates the voltage balance equation of the input inductor. The current flowing through the inductor is obtained by using Eq. (5). Solving Eq. (5) and Eq. (6), which provide the output voltage and current of the boost converter as shown in Eqs. 7 and 8. Where RT refers to the resistance of the PV terminal. It is assumed that both resistances control the duty cycle. The design specification and corresponding formula are used to estimate the inductance and capacitance of conventional boost converters.
Design and analysis of switched switching boost converter
SSBC is important because it has a high voltage conversion ratio and makes very little oscillation in both static and moving conditions 71. Also, you don’t need any magnetic parts to make the voltage signature better. Result: The cost of the converter is reduced marginally, as is the size of the converter. The proposed converter has two capacitors, four diodes, an inductor, and a switch. When the switch is turned on, the capacitor C1 charges, as shown in Fig. 6a. Whenever the switch is closed, current flows to the capacitor C1 through diodes D3 and D1, as shown in Fig. 6b. Also, inductor L1 stored electrical energy in its magnetic field. These stored electrical energies are transferred to the load when diode D3 is in a biased condition. When diode D4 is in the “reverse biased” state, the energy stored in capacitor C2 and inductor L2 is sent to the load 72. This can be expressed mathematically by following Eqs. (12) to (15). When the switch is turned off, as shown in Fig. 6c. The diode D1 is forward-biased, and the capacitor C1 begins to charge. Results, inductor current, and voltage across the capacitor are estimated by the following relations: (16) to (19).
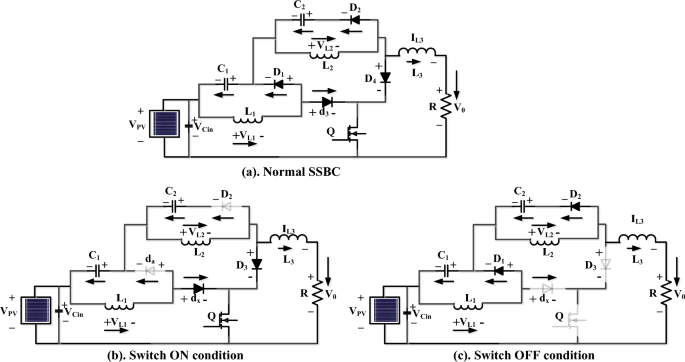
(a) Proposed SSBC, (b) SSBC conduction mode of operations, (c) Stackable switch boost converter (SSBC).
From inductor L1, the stored energy is transferred to the load with the slope of Vc1/L1. Likewise, L2 releases the energy with a slope of Vc2/L2. The voltage across the SCB’s load resistance is the sum of the energy voltages across the capacitors Vc1 and Vc2, as well as the solar PV voltage. Figure 6 shows on a graph how the current flows through the inductor and how much voltage is across the capacitor as the switches are turned on and off. It showed. Whoever turns on the switch immediately charges the inductors L1 and L2, whereas it releases stored energy through capacitor C1 and inductor L2. Using the voltage and current harmonics, the slope of the energy storage element can be estimated. The voltage across each element is estimated by the following equations: (20) to (23).
Parameter selection of optimization controllers
The PSO algorithm finds the best solution in two ways: first, the particle itself finds the best solution by moving towards it, and second, the entire population finds the best solution, respectively. The PSO optimization is based on the following two Eqs. (24) and (25).
where qi is the position of the ith particle. ({eta }_{i}) is the velocity of the ith particle. k is the iteration number. w is the inertia weight. r1 and r2 are the random variables and it is uniformly distributed within [0,1]. c1 and c2 are the acceleration coefficients. Pbesti is used to store the best position of ith particle. Gbesti is the best position if all particles in the entire population.
From the Eq. 1 and 2 observed that the position of the particle and velocity have a direct correlation, respectively. The new position (qi(s+1)) is the sum of the old position and the new velocity (lambda i(x+1)) it can be estimated by the Eq. (1).The moment of the particle is decided by the objective function here it is called fitness value evaluation. For each reference voltage, there is a corresponding power it is called a fitness function to decide the movement 73,74,75,76,77,78.The position of the particles is adjusted by the following Eqs. (26).
To implement the above process for MPPT
where, Vsp1, Vsp2 …… Vspn is called a particular particle as mentioned in Eq. 27, several studies proved that only three number particlesprovidean accurate and fast solution. Therefore, here three particles are used such as Vsp1, Vsp2, and Vsp3, respectively. These sample voltages are taken from the P–V and I-V characteristics of solar PV and it covers the entire curve.
From the above Eq. 28, the objective function is power generated by the PV array is larger than that of the previous power subsequently particle movement is initiated otherwise vice versa. The inertial weight is represented as w and it is 0.4 and the local learning coefficient and global learning coefficient are represented as c1 and c2 these values are equal to 1.2. These two parameters are used to find the best local and global maximum power point, respectively.At first, a voltage sample is initiated because it is the solution vector. Meanwhile, the estimated duty cycle at this moment is transmitted to the converter. Also, all the particles are moving towards their local best solution. However, Gbest is also present among these particle solutions. Hence, it offered the best fitness value compared to all other solutions. Subsequently, a new velocity has been estimated using perturbations to the voltage, resulting in a new voltage position. All particles progress toward the global optimal position during subsequent iterations. When particles reach the MPP result, they close at the Gbest position. Therefore, the local best solution’s velocity and the Global best solution’s velocity become zero. Finally, MPP is reached in this situation, velocity becomes zero, and velocity position is unchanged 79,80.The flower pollination MPPT algorithm is developed based on the following rules. The local pollinators are biotic and self-pollinating. The potential for reproduction varies according to flower constancy. It correlates with similar flowers undergoing pollination. The second probability controls local and global pollination. The global pollutant sources are biological and cross-pollinated; few flowers fly a long distance and obey levy flights. To develop a mathematical model of flower pollination by using global pollination and flower consistency, which are expressed as the following equations:
where ({{text{K}}}_{{text{i}}}^{{text{t}}+1}), is a solution vector at iteration t. The best solution forthe boost converter duty cycle is H. The step size can be controlled by the (upgamma ). The best step size of the levy flight search is represented using ({text{L}}(uplambda )). However, the incest may fly long distances and it can be expressed in Eqs. (30), and (31).
(Gamma (lambda )) called as gamma function.The local pollination can be expressed by the Eq. (31)
where (mathrm{{text{K}}}_{{text{x}}},{{text{K}}}_{{text{y}}}) representing the similar spices pollen from the different flowers. The switching probability is a crucial factor that should be used effectively to switch between global and local solutions. Here the number of population size can be represented as 3. Moreover, the number of iterations taken is 10. The crucial factor probability of the switch value is assumed 0.3. The global search is performed by the probability of switch whereas the local search is performed by the proximity probability. The pollination value 0.3 represents 30% algorithm doesa local search and remining will do a global search respectively. The boundary of the solution vector lies between 0 and 1.
Simulation results and analysis
At first, the simulation study was carried out on a conventional boost converter along with the conventional MPPT controllers such as Perturb & Observe (P&O), Incremental Conductance (INC), VSS, and FSSOV at 1000 W/m2 for estimating converter efficiency. From the simulation study, it was found that the P&O algorithm produced huge oscillation whereas INC and FSSOV produced very less oscillations as shown in Fig. 7. The INC produced lesser power which is 8.1324*e4 W whereas FSOSOV produced 9.554*e4W and 9.261*e4W by INC Fig. 7. The time required to reach a stable value for FSSOV is 0.036 s 0.0356 s is required for INC. The simulation was also carried out with bio-inspired MPPTs. As shown in the Fig. 8, FPNA produced a large oscillation, it took 0.435 s to reach the stable value. While, CSO MMPT took 0.161 s to reach stable whereas 0.161 s is required for PSO to reach a stable value, respectively. The CSO tracks the high-power output from the solar PV compared to FPNA and PSO as shown in Table 1.
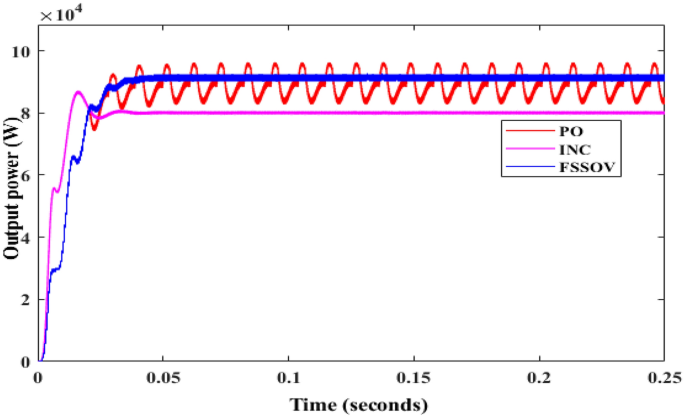
CBC along with CMPPT controllers output power.
CBC with BMPPT controllers output power.
In the environmental condition, the voltage varies continuously concerning time as shown in Fig. 9. As a result, the maximum power generated by the solar PV system varies. Hence, evaluation of the tracking efficiency of MPPT is essential, so the conventional boost converter with variable irradiation is simulated by using the MATLAB Simulink. The irradiation levels are 1000 W/m2 for 0 to 0.2 duty cycles, 700 W/m2 for 0.2 to 0.4 duty cycles, and 400 W/m2 for 0.4 to 0.6 duty cycles, respectively. Figure 10 depicts the relationship between voltage and current under variable irradiation. The PO-based MPPT oscillates more than the others. However, at 1000 W/m2, it produced483.9 V, which was reduced to 353 V at 700 W/m2 and 233.2 V at 200 W/m2, as shown in Table 2. Whereas 420.2 V is produced by the INC at 1000 W/m2, it produces 370.6 V at 700 W/m2 and 234.0 V at 200 W/m2. The FSSO is produced at 410 V at 100 W/m2, reduced to 367.0 V at 700 W/m2, and reached at 234 W at 200 W/m2 as shown in Fig. 10. The simulation revealed that P&O causes more oscillation at all levels of irradiation. FSSOV and INC, on the other hand, produce very few ripples in the output voltage as shown in Fig. 10.
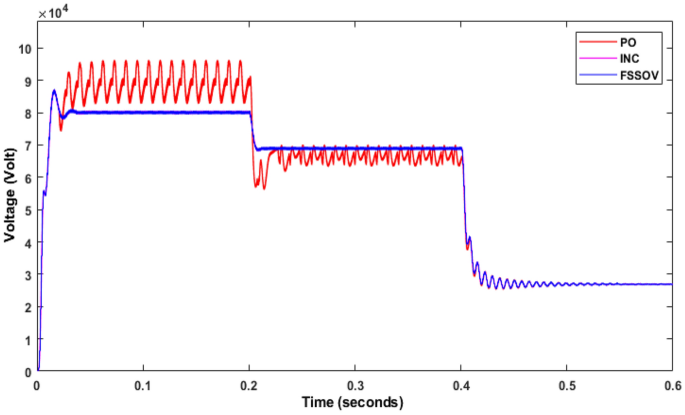
CBC with CMPPT controllers output voltage.
CBC with BMPPT under variable Irradiations.
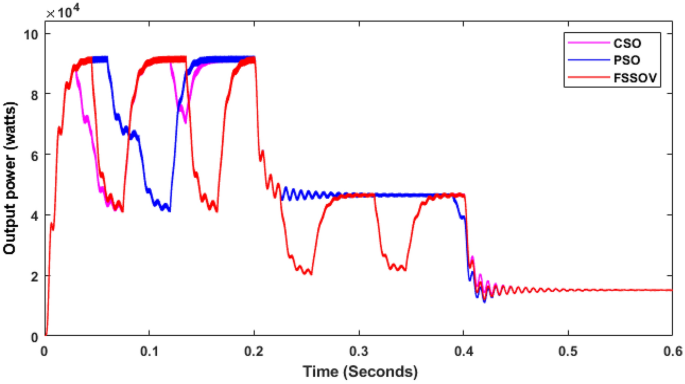
It is observed that the CSO-based MPPTs produce 9208 W at 1000 W/m2, which is reduced to 4608 W at 700 W/m2 and 154 W at 200 W/m2. The comparison between the effectiveness of CSO and PSO is very low. However, FSSOV performance is very poor under variable irradiation conditions. All MPPTs take time to track the maximum power during the first duty cycle. In the second duty cycle, PSO and CSO MPPTs track the maximum possible power faster than each other. Also, the tracking speed of CSO is superior to that of PSO under low irradiation.
From the simulation, it was observed that P&O with SSBC produces huge oscillations, and it took 1 s to reach the stable voltage as shown in Fig. 11. The energy conversion range is 1.530 W with P&O as shown in Fig. 12. Whereas INC with SSBC is produced at 1450 W and takes 0.6 s to reach a stable value, FSSOV is produced at 1504 W and takes 0.85 s to reach a stable value. It is assumed that INC and SSBC provide the best performance. The SSBC with FPA produces 13,060 W and produces heavy oscillation as shown in Fig. 12. The SSBC with PSO, produces 13700W with much less oscillation than the FPA. Furthermore, PSO has a maximum power of 16,430 at 0.364 s, whereas FPA has a maximum power of 17,690 at 0.495 s. Within 0.256 s, the CSO with SCB produces a maximum of 16,840 W. In comparison to others, it produces 14,560 watts of average power. In addition, it produced much less oscillation than others. The output power of SSBC is given in Table 3.
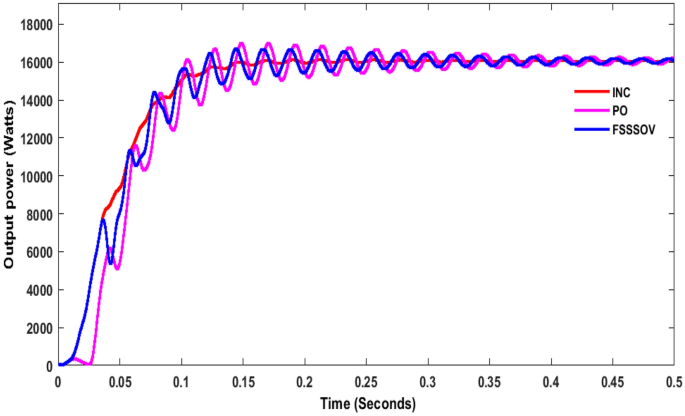
Output power of SSBC with CMPPT at constant irradiations.
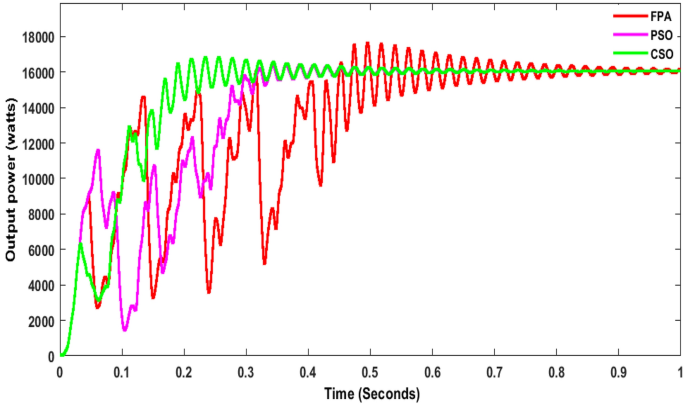
Output Power of SSBC with BMPPT at constant irradiations.
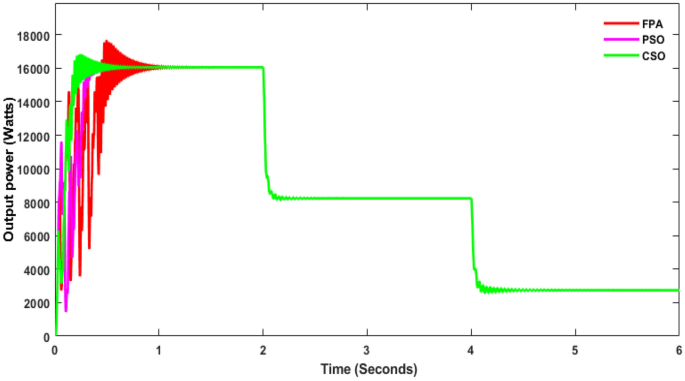
As shown in Fig. 13, INC is 16,130 W at 1000 W/m2 whereas it is reduced to 8231 W at 700 W/m2 and finally, it is reached 2337 W at 400 w/m2 as shown in Fig. 13. The energy yield potential of the SSBC with CMPPT is almost equal for all the sampling irradiations but at low irradiation response time of P&O and INC MPPT is faster that of FSSOV. The conventional boost converter produced very little oscillation with the SSBC. As shown in Fig. 14, CSO with SSBC produces 17,690 W at 1000 W/m2 and it is reduced to 8759W at 700 W/m2, finally reaching 2739 at 400 W/m2. Also, it took 0.459 s to reach a stable power. Furthermore, it is worth noting that all BMPPT with SSBC produces nearly the same power. The voltage conversion ratio of SCB with BMPPT is comparable to that of SSBC with CMPPT. Furthermore, CSO with BMPPT produces significantly less oscillation than other methods. The efficiency of CSO with SSBC is higher than that of others as shown in Table 4.
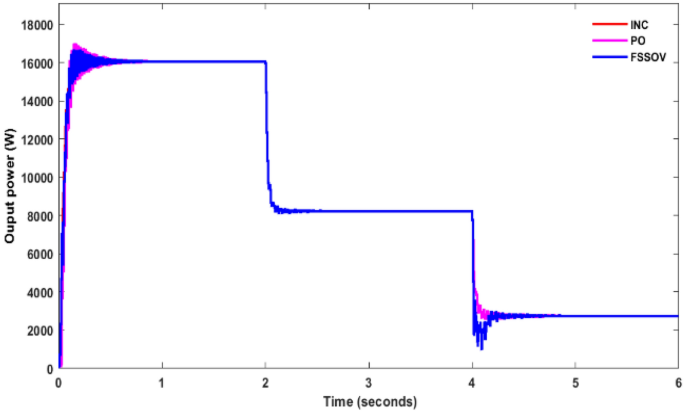
Output power of SSBC with CMPPT under variable irradiations.
Output power of SSBC with TMPPT under variable irradiations.
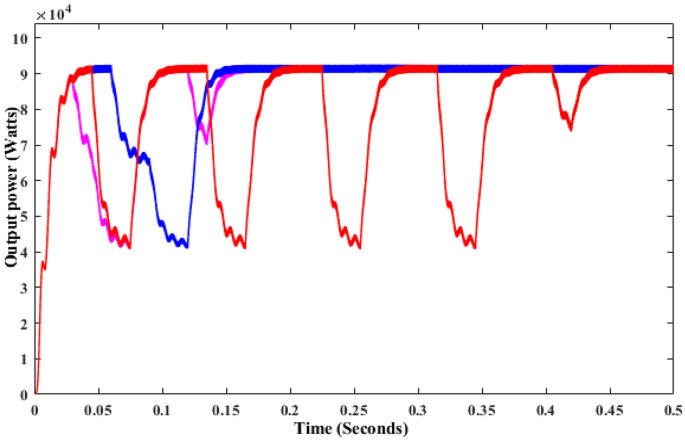
The above critical studies found that the proposed converter with BMPPT’s efficiency is higher than that of others under steady and variable irradiations. Whereas, the performance of SSBC with BMPPT under dynamic irradiation is carried out in this section. It is essential, due to the change in irradiance on Earth, that the atmosphere is dynamic. Hence, dynamic irradiations such as 1000W/m2 for 0 to 2 s, 600W/m2 for 2 to 3 s, 500W/m2 for 3 to 5 s, 700W/m2 for 5 to 8 s, 800W/m2 for 8 to 10 s used for further analysis. The result shows that CSO MPPT with SCB produced higher power than others as shown in Fig. 15. In addition, the time to track the maximum power by CSO is 0.256 s which is lower than that of others. SSBC with CSO MPPT produces very low ripple power that of others. The FPA and PSO with SSBC produced moderate ripples on the output power. It is inferred that CSO is the best choice to extract the maximum power from solar PV under all the conditions, respectively.
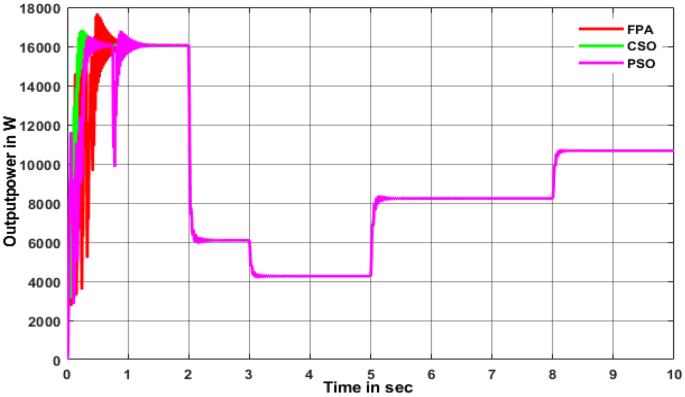
SSBC under dynamic irradiations.
Conclusion
The research proposed an SSBC with CSO MPPT for the solar PV systems. It was observed that the P&O with CBC produced more ripples under constant and variable irradiations. Furthermore, FSSOV has produced a higher voltage than the other TMPPTs. It is evident from the results that the bio-inspired MPPT with CBC shows fewer ripples in the output power than the others. The efficiency of CSO with TBC is superior to that of PSO and FSSOV. The SSBC with TMMPT shows more efficiency of 93.8% when compared with other MPPTs. The results also reveal that the SSBC with BMPPT produced significantly higher output power than the TMPPT with SSBC. In addition, in dynamic conditions, CSO MPPT with SSBC took less time to reach a stable level than PSO and FFPA. Finally, when compared to the conventional boost converter, the proposed SSBC with CSO shows better results.
Data availability
The datasets used and/or analyzed during the current study are available from the corresponding author on reasonable request
Abbreviations
- SPV:
-
Solar photovoltaic
- MPPT:
-
Maximum power point tracking
- MPP:
-
Maximum power point
- CSO:
-
Cuckoo search optimization
- PO:
-
Perturb and observe
- INC:
-
Incremental and conductance
- FSSOV:
-
Variable step size fractional incremental conductance
- PSO:
-
Particle swarm optimization
- RER:
-
Renewable energy resources
- TBC:
-
Traditional boost converter
- Vt:
-
Terminal voltage
- VT:
-
Total voltage
- d:
-
Duty cycle of conventional boost converter
- IT:
-
Terminal current
- RT:
-
Terminal resistance
- SCB:
-
Stackable switched capacitor
- Vspv:
-
Solar photovoltaic
- L1:
-
Input inductance
- Ca:
-
Input capacitor
- IL1:
-
Current flowing through inductor
- Vo:
-
Output voltage
- L2:
-
Smooth inductance
- C2:
-
Output capacitor
- Vc1:
-
Voltage across input capacitor C1
- NMPPT:
-
Bioinspired MPPT
- FPNA:
-
Flower pollination MPPT
- CMPPT:
-
Conventional MPPT
References
-
Kiran, S. R. et al. Reduced simulative performance analysis of variable step size ANN based MPPT techniques for partially shaded solar PV systems. IEEE Access 10, 48875–48889 (2022).
-
Basha, C. H. H., Rani, C. & Odofin, S. A review on non-isolated inductor coupled DC-DC converter for photovoltaic grid-connected applications. Int. J. Renew. Energy Res. (IJRER) 74, 1570–1585 (2017).
-
Basha, Ch Hussaian, C. Rani, and S. Odofin. Analysis and comparison of SEPIC, Landsman and Zeta converters for PV fed induction motor drive applications. In 2018 iIternational Conference on Computation of Power, Energy, Information and Communication (ICCPEIC) (IEEE, 2018).
-
Basha, C. H. & Rani, C. Design and analysis of transformerless, high step-up, boost DC-DC converter with an improved VSS-RBFA based MPPT controller. Int. Trans. Electr. Energy Syst. 30(12), e12633 (2020).
-
Basha, C. H. & Matcha, M. A new design of transformerless, non-isolated, high step-up DC-DC converter with hybrid fuzzy logic MPPT controller. Int. J. Circuit Theory Appl. 50(1), 272–297 (2022).
-
Hussaian Basha, C. H. et al. “Mathematical design and analysis of photovoltaic cell using MATLAB/Simulink. In Soft Computing for Problem Solving: SocProS 2018 (Springer Singapore, 2020).
-
Govinda Chowdary, V. et al. “Hybrid fuzzy logic-based MPPT for wind energy conversion system. In Soft Computing for Problem Solving SocProS 2018 (Springer Singapore, 2020).
-
Nadimuthu, L. P. R. et al. Energy conservation approach for continuous power quality improvement: A case study. IEEE Access 9, 146959–146969 (2021).
-
Mariprasath, T., Kirubakaran, V., Sreedhar Madichetty, K. & Amaresh,. An experimental study on spectroscopic analysis of alternating liquid dielectrics for transformer. Electr. Eng. 103, 921–929. https://doi.org/10.1007/s00202-020-01136-x (2021).
-
Mariprasath, T., Kirubakaran, V. & Ravindaran, M. Modern Trends in Renewable Energy Technology (Cambridge Scholars Publishing, 2019).
-
Khan, N. A. & Islam, M. Q. Study on the effects of winglets: Wind turbine blades having circular arc blade section profile. Int. J. Energy Environ. Eng. 12, 837–853 (2021).
-
Sim, Y. H., Yun, M. J., Lee, D. Y. & Cha, S. I. Origami-foldable tessellated Crystalline-Si solar cell module with metal textile-based stretchable connections. Solar Energy Mater. Solar Cells 231, 111318 (2021).
-
Sohani, A. et al. Comparative study of temperature distribution impact on prediction accuracy of simulation approaches for poly and mono crystalline solar modules. Energy Convers. Manag. 239, 114221 (2021).
-
Mirza, A. F., Mansoor, M., Ling, Q., Yin, B. & Javed, M. Y. A Slap-Swarm Optimization based MPPT technique for harvesting maximum energy from PV systems under partial shading conditions. Energy Convers. Manag. 209, 112625 (2020).
-
Bhattacharyya, S., Samanta, S. & Mishra, S. Steady output and fast tracking MPPT (SOFT-MPPT) for P&O and InC algorithms. IEEE Trans. Sustain. Energy 12(1), 293–302 (2020).
-
Mishra, J. A novel auto- tuned adaptive frequency and adaptive step- size incremental conductance MPPT algorithm for photovoltaic system. Int. Trans. Electr. Energy Syst. 2020, 1–15 (2021).
-
Bouaouaou, H., Lalili, D. & NasserdineBoudjerda,. Model predictive control and ANN-based MPPT for a multi-level grid-connected photovoltaic inverter. Electr. Eng. 104, 1229–1246 (2021).
-
Gaur, P. The Survey of MPPT under non-uniform atmospheric conditions for the photovoltaic generation systems. Int. J. Inf. Technol. 13(2), 767–776 (2021).
-
Priyanka, G, SK Dash, and V Padmaja Investigation of the efficiency for fuzzy logic-based MPPT algorithm dedicated for standalone low-cost pv systems. Intelligent Systems, 201–215 (2021)
-
Bakkar, M. PV systems control using fuzzy logic controller employing dynamic safety margin under normal and partial shading conditions. Energies 14(4), 1–20 (2021).
-
Kumbhar, A, et al. Reducing grid dependency and operating cost of micro grids with effective coordination of renewable and electric vehicle’s storage. Soft computing for problem solving In: Proceedings of the SocProS 2022 639–653 (Springer Nature Singapore, 2023)
-
Kumari, P. A. et al. Application of DSO algorithm for estimating the parameters of triple diode model-based solar PV system. Sci. Rep. 14(1), 3867 (2024).
-
Kiran, S. R. et al. Design and performance analysis of hybrid optimization MPPT controller for proton exchange membrane fuel cell system with DC-DC converter. Materials: Today Proceedings https://doi.org/10.1016/j.matpr.2023.07.077 (2023).
-
Hussaian Basha, C. H. et al. Design of adaptive VSS-P&O-based PSO controller for PV-based electric vehicle application with step-up boost converter. In Pattern Recognition and Data Analysis with Applications 803–817 (Springer Nature Singapore, 2022).
-
Basha, CH Hussaian, et al. Design of an adaptive fuzzy logic controller for solar PV application with high step-up DC–DC converter. In Proceedings of fourth international conference on inventive material science applications: ICIMA 2021. (Springer Nature 2021)
-
Palati, M. et al. Temperature reduction analysis of solid insulating materials dipped in natural ester plus inorganic oils. Materials: Today Proceedings https://doi.org/10.1016/j.matpr.2023.07.078 (2023).
-
Kiran, SR, et al. Performance analysis of bionic swarm optimization techniques for PV systems under continuous fluctuation of irradiation conditions. In: Congress on Control, Robotics, and Mechatronics. (Springer Nature Singapore, 2023).
-
Sastika, M. D., et al. IoT Application on Home Automation with Smart Meter. In International conference on computer vision and robotics. (Springer Nature Singapore, 2023).
-
Velpula, S, et al. Impact of DFIM controller parameters on ssr characteristics of wind energy conversion system with series capacitor compensation. In International Conference on Computer Vision and Robotics. (Springer Nature Singapore, 2023).
-
Rafikiran, S, et al. Application of battery storage controlling by utilizing the adaptive neural network controller at various local load conditions. In International Conference on Computer Vision and Robotics. (Springer Nature Singapore, 2023).
-
Prakasha, P. K., V. Prashanth, and C. H. Hussaian Basha. Design and analysis of sliding mode controller for solar PV two-stage power conversion system. In International Conference on Computer Vision and Robotics. (Springer Nature Singapore, 2023).
-
Hussaian Basha, C. H. et al. Design of high voltage gain DC-DC converter with fuzzy logic controller for solar PV system under dynamic irradiation conditions. In Proceedings of the iIternational Conference on Paradigms of Computing, Communication and Data Sciences: PCCDS 2022 (Springer Nature Singapore, 2023).
-
Puppala, R. et al. Framework for smart grid to implement a price elasticity-based peak time rebate demand response program. Front. Energy Res. 10, 1079695 (2023).
-
Rafikiran, S. et al. Design and implementation of hybrid MPPT controller for FC based EV system with boost DC-DC converter. J. Intell. Fuzzy Syst. Preprint https://doi.org/10.3233/JIFS-224007 (2023).
-
Basha, CH Hussaian, et al. Performance analysis of satellite image classification using deep learning neural network. In: iIternational Conference on Sustainable and Innovative Solutions for Current Challenges in Engineering & Ttchnology (Springer Nature Singapore, 2022).
-
Hussaian Basha, C. H., et al Design and analysis of genetic algorithm optimization-based ANFIS controller for interleaved DC-DC converter-fed PEMFC system. In congress on intelligent systems (Springer Nature Singapore, 2022).
-
Basha, CH Hussaian, et al. Design and analysis of an adaptive soft computing power point tracing techniques for time-varying irradiation condition of solar PV. In Computer Vision and Robotics: Proceedings of CVR 2021 (Springer Singapore, 2022) 381–392.
-
Rajendra, K. K., Amit, K. & Sidhartha, P. A Modified grey wolf optimization with cuckoo search algorithm for load frequency controller design of hybrid power system. Appl. Soft Comput. 124, 109011 (2022).
-
Eltamaly, A. M. An improved Cuckoo Search algorithm for maximum power point tracking of photovoltaic systems under partial shading conditions. Energies 953(14), 1–26 (2021).
-
Koh, J. S., Tan, R. H., Lim, W. H. & Tan, N. M. A modified particle swarm optimization for efficient maximum power point tracking under partial shading condition. IEEE Trans. Sustain. Energy 14, 1822–1834 (2023).
-
Priyadarshi, N., Padmanaban, S., Holm-Nielsen, J. B., Blaabjerg, F. & Bhask, M. S. An experimental estimation of hybrid ANFIS–PSO-based MPPT for PV grid integration under fluctuating sun irradiance. IEEE Syst. J. 14, 1218–1229 (2020).
-
Diab, A. A. Z. & Rezk, H. Global MPPT based on flower pollination and differential evolution algorithms to mitigate partial shading in building integrated PV system. Solar Energy 157, 171–186 (2017).
-
Tagayi, R. K., Baek, J. & Kim, J. Flower pollination global peak search algorithm for partially shaded solar photovoltaic system. J. Build. Eng. 66, 105818 (2023).
-
Mariprasath, T., et al. Design and analysis of an improved artificial neural network controller for the energy efficiency enhancement of wind power plant. In Computational Methods and Data Engineering: Proceedings of ICCMDE 2021. (Springer Nature Singapore, 2022). 67–77.
-
Patil, Shweta S., et al. Performance analysis of image caption generation using deep learning techniques.” In International Conference on Microelectronic Devices, Circuits and Systems (Springer Nature Switzerland, 2022).
-
Hussaian Basha, C. H. et al. An experimental analysis of degradation of cellulosic insulating material immersed in natural ester oil for transformer. ECS Trans. 107(1), 18957 (2022).
-
Murali, M., et al. Performance analysis of different types of solar photovoltaic cell techniques using MATLAB/simulink. In Proceedings of Fourth International Conference on Inventive Material Science Applications: ICIMA 2021 (Springer Singapore, 2022).
-
Rafikiran, S. et al. Design of high voltage gain converter for fuel cell based EV application with hybrid optimization MPPT controller. Mater.: Today Proc. https://doi.org/10.1016/j.matpr.2023.03.770 (2023).
-
Murali, M., et al. “Design of high step-up interleaved boost converter-fed fuel cell-based electric vehicle system with neural network controller In Pattern Recognition and Data Analysis with Applications (Springer Nature Singapore, 2022). 789–801.
-
Kiran, SR, et al. “Design of artificial intelligence-based hybrid MPPT controllers for partially shaded solar PV system with non-isolated boost converter.” In Computer Vision and Robotics: Proceedings of CVR 2021. (Springer Singapore, 2022). 353–363.
-
Hussaian Basha, C. H. et al. Design of SVPWM-based two-leg VSI for solar PV grid-connected systems. In Soft Computing for Problem Solving SocProS 2018 (Springer Singapore, 2020).
-
Rafikiran, S. et al. Design and performance analysis of hybrid MPPT controllers for fuel cell fed DC-DC converter systems. Energy Rep. 9, 5826–5842 (2023).
-
Reddy, K. R. et al. A novel on energy management strategy with maximum exploitation of renewables and EV storage in distribution networks. Int. Trans. Electr. Energy Syst. https://doi.org/10.1155/2023/1365608 (2023).
-
Basha, C. H. H. et al. Design of GWO based fuzzy MPPT controller for fuel cell fed EV application with high voltage gain DC-DC converter. Mater.: Today Proc. https://doi.org/10.1016/j.matpr.2023.03.727 (2023).
-
Basha, C. H. H. & Rani, C. Different conventional and soft computing MPPT techniques for solar PV systems with high step-up boost converters: A comprehensive analysis. Energies 13(2), 371 (2020).
-
Hussaian Basha, C. H. & Rani, C. Performance analysis of MPPT techniques for dynamic irradiation condition of solar PV. Int. J. Fuzzy Syst. 22(8), 2577–2598 (2020).
-
Hussaian Basha, C. H. et al. Development of cuckoo search MPPT algorithm for partially shaded solar PV SEPIC converter. In Soft Computing for Problem Solving: SocProS 2018 (Springer Singapore, 2020).
-
Hussaian Basha, C. H. et al. Simulation of metaheuristic intelligence MPPT techniques for solar PV under partial shading condition. In Soft Computing for Problem Solving: SocProS 2018 (Springer Singapore, 2020).
-
Basha, C. H. H. et al. Simulative design and performance analysis of hybrid optimization technique for PEM fuel cell stack based EV application. Mater. Today: Proc. 52, 290–295 (2022).
-
Udhay Sankar, V. et al. Application of WDO for decision-making in combined economic and emission dispatch problem. In Soft Computing for Problem Solving: SocProS 2018 (Springer Singapore, 2020).
-
Basha, C. H. H. & Rani, C. A New single switch DC-DC converter for PEM fuel cell-based electric vehicle system with an improved beta-fuzzy logic MPPT controller. Soft Comput. 26(13), 6021–6040 (2022).
-
Kiran, S. R. et al. Thermal degrade analysis of solid insulating materials immersed in natural ester oil and mineral oil by DGA. Mater. Today: Proc. 52, 315–320 (2022).
-
Kiran, S. R. et al. A new design of single switch DC-DC converter for PEM fuel cell based EV system with variable step size RBFN controller. Sādhanā 47(3), 128 (2022).
-
Basha, Ch Hussaian, C. Rani, and S. Odofin. Design and switching loss calculation of single leg 3-level 3-phase VSI.” In 2018 International Conference on Computation of Power, Energy, Information and Communication (ICCPEIC). IEEE, (2018).
-
Udhay, S. V. et al. “Application of wind-driven optimization for decision-making in economic dispatch problem. In Soft Computing for Problem Solving: SocProS 2018 (Springer Singapore, 2020).
-
Rafikiran, S. et al. Design and performance evaluation of solid oxide-based fuel cell stack for electric vehicle system with modified marine predator optimized fuzzy controller. Mater. Today: Proc. 60, 1898–1904 (2022).
-
Murali, M., et al. Design and analysis of neural network-based MPPT technique for solar power-based electric vehicle application. In Proceedings of Fourth International Conference on Inventive Material Science Applications: ICIMA 2021 (Springer Singapore, 2022).
-
Basha, C. H. & Rani, C. Application of fuzzy controller for two-leg inverter solar PV grid connected systems with high voltage gain boost converter. J. Eng. Sci. Technol. Rev. 14(2), 8 (2021).
-
Hussaian Basha, C. H., et al. Design and performance analysis of common duty ratio controlled zeta converter with an adaptive P&O MPPT controller. In Proceedings of iIternational Conference on Data Science and Applications: ICDSA 2021, (Springer Singapore, 2022).
-
Basha, C. H. H. et al. An improved differential evolution optimization controller for enhancing the performance of PEM fuel cell powered electric vehicle system. Mater. Today: Proc. 52, 308–314 (2022).
-
Basha, CH Hussaian, et al. Design of an LPF based slider controller for THD reduction in solar PV B-4 inverter. In 2019 IEEE Iiternational Conference on Electrical, Computer and Communication Technologies (ICECCT). IEEE, (2019).
-
Ye, H. High step-up interleaved dc/dc converter with high efficiency. Energy Sources, Part A https://doi.org/10.1080/15567036.2020.1716111 (2020).
-
Ahmed, J. & Salam, Z. A maximum power point tracking (MPPT) for PV system using Cuckoo search with partial shading capability. Appl. Energy 119, 118–130 (2014).
-
Yang X-S, Deb S (2009) Cuckoo search via Lévy flights. Nature & Biologically Inspired Computing. In NaBIC 2009 World Congress on, 1–5.
-
Teuschl, Y., Taborsky, B. & Taborsky, M. How do cuckoos find their hosts the role of habitat imprinting. Anim. Behav. 56, 1425–1433 (1998).
-
Reynolds, A. M. & Frye, M. A. Free-flight odor tracking in Drosophila is consistent with an optimal intermittent scale-free search. PLoS ONE 2, e354 (2007).
-
Yang, X.-S. & Deb, S. Multi objective cuckoo search for design optimization. Comput Oper Res 40, 1616–1624 (2011).
-
Zafar, M. H., Khan, N. M., Mirza, A. F. & Mansoor, M. A novel meta-heuristic optimization algorithm based MPPT control technique for PV systems under complex partial shading condition. Sustain. Energy Technol. Assess. 47, 101367 (2021).
-
Ayop, R. & Tan, C. W. Design of boost converter based on maximum power point resistance for photovoltaic applications. Sol. Energy 160, 322–335 (2018).
-
Valdez-Resendiz, J. E., Rosas-Caro, J. C. & Mayo-Maldonado, J. C. A Quadratic boost converter based on stackable switching stages. IET Power Electron. 11, 1373–1381 (2018).
Author information
Authors and Affiliations
Contributions
T.M., C.H.H.B., B.K. and A.A. wrote the main manuscript text and T.M., C.H.H.B., B.K. and A.A. prepared figures. All authors reviewed the manuscript.
Corresponding author
Ethics declarations
Competing interests
The authors declare no competing interests.
Additional information
Publisher’s note
Springer Nature remains neutral with regard to jurisdictional claims in published maps and institutional affiliations.
Rights and permissions
Open Access This article is licensed under a Creative Commons Attribution 4.0 International License, which permits use, sharing, adaptation, distribution and reproduction in any medium or format, as long as you give appropriate credit to the original author(s) and the source, provide a link to the Creative Commons licence, and indicate if changes were made. The images or other third party material in this article are included in the article’s Creative Commons licence, unless indicated otherwise in a credit line to the material. If material is not included in the article’s Creative Commons licence and your intended use is not permitted by statutory regulation or exceeds the permitted use, you will need to obtain permission directly from the copyright holder. To view a copy of this licence, visit http://creativecommons.org/licenses/by/4.0/.
About this article
Cite this article
Mariprasath, T., Basha, C.H.H., Khan, B. et al. A novel on high voltage gain boost converter with cuckoo search optimization based MPPTController for solar PV system.
Sci Rep 14, 8545 (2024). https://doi.org/10.1038/s41598-024-58820-2
-
Received: 10 February 2024
-
Accepted: 03 April 2024
-
Published: 12 April 2024
-
DOI: https://doi.org/10.1038/s41598-024-58820-2
Keywords
Comments
By submitting a comment you agree to abide by our Terms and Community Guidelines. If you find something abusive or that does not comply with our terms or guidelines please flag it as inappropriate.