
State and Local Permitting Restrictions on Solar Energy Development – R Street Institute
Real Solutions
Introduction
Like wind power, photovoltaic (PV) solar power has also been impacted by an increasing number of state and local ordinances that restrict where solar power may be deployed. This analysis, similar to the prior one in the series on wind power, utilizes the National Renewable Energy Laboratory’s (NREL) database of state and local ordinances related to wind and solar siting. We then determine the potential impact of these ordinances on solar power development, and what trends are observable in the data.
There are Many County-Level Ordinances for Solar, But Few Are Restrictive
The NREL database for PV solar siting catalogues 838 state and local ordinances. In the database, there are 282 distinct entries for counties, meaning about 9 percent of counties in the United States have at least one restriction on the siting of PV solar. There is also one state with solar ordinances, Vermont, which has 14 counties, and if included would mean 296 counties have a solar ordinance, or still 9 percent of U.S. counties.
Most of these ordinances are related to the minimum setback distance from a feature or property line that is required for new solar facilities, but many are also related to the maximum permitted height of PV solar installations, as well as their minimum and maximum permitted land usage. For this analysis, height restrictions (189 of the ordinances) were ignored, as it is unclear to what extent these may inhibit the installation of PV solar since few of the height restrictions seem to be within the expected height of a PV solar array. Instead, we focus on setback requirements, which directly affect the available land for siting new PV solar, as well as requirements for minimum or maximum installation sizes, and outright bans and moratoria preventing new PV solar installation.
In our analysis of wind turbines, we found that roughly a third of ordinances governing setback distance exceeded 300 meters. However, for PV solar arrays, the setback requirements are generally far more lenient, with most having setback requirements under 100 meters.
We also analyzed ordinances that could be restrictive to new PV solar siting, such as minimum requirements for land that would prevent the siting of community solar, or maximum land usage that would prevent the siting of new utility-scale solar. We combined this with the setback distances to categorize the severity of restrictions on siting new PV solar. The same setback distances we used for wind apply for our estimated level of restrictiveness—with highly restrictive ordinances being ones that require setbacks greater than 500 meters and less restrictive being under 200 meters. The two state-level ordinances, both in Vermont, are excluded as they both fall in our “less restrictive” category and do not generally impact our findings.
Table: County-Level Solar Ordinances by Level of Restriction
| Setback Ordinances | Installation Size Ordinances | Combined | Share of Total Ordinances | |
| Less Restrictive | 376 | 46 | 422 | 93% |
| Nominally Restrictive | 3 | 7 | 10 | 2% |
| More Restrictive | 2 | 8 | 10 | 2% |
| Highly Restrictive | 1 | 5 | 6 | 1% |
| Prohibition | 4 | N/A | 4 | 1% |
Our findings show that, in contrast with ordinances restricting wind deployment, there are few ordinances that are substantially inhibiting to the deployment of new PV solar. This is likely because ordinances governing setback are often intended to minimize noise or avoid structures interfering with sightlines and landscapes. These are less of a concern for PV solar, which emits less noise and is less visible with reduced setbacks, owing to its much lower height than wind turbines. Notably, there are also fewer ordinances restricting PV solar than wind, especially at the state level.
A 2023 NREL analysis found that for wind power, imposing the top 10 percent most restrictive setback ordinances nationwide would reduce the potential sited capacity of wind power by 87 percent, but that analysis also applied the same methodology to solar ordinances and found that potential solar capacity would only be reduced by 38 percent (going from 147 terawatts (TW) to 91). Our analysis, which utilizes the same database, is consistent with these results, as setback requirements for PV solar are generally less restrictive than for wind.
In terms of how significant a 38 percent reduction in potential capacity is, current solar capacity is expected to reach 131 gigawatts (GW) by the end of 2024, meaning even under the application of widespread setback ordinances for solar power, a potential capacity of 91 TW would be a 694-fold increase from current levels. For context, the Princeton Net-Zero America study’s pathways to decarbonization require an increase of solar power use of between 10 and 42 times current levels.
Trends in New PV Ordinances
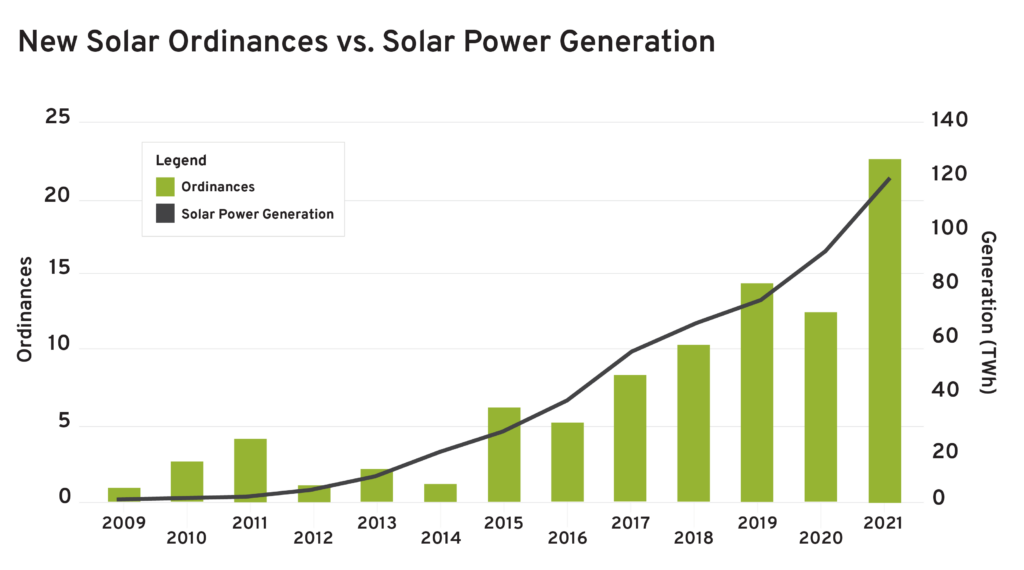
In our analysis of wind ordinances, we found that not only were there numerous county-level wind ordinances but that the rate of adoption for new ordinances was accelerating. While there are fewer solar ordinances, this trend is similar for PV solar, which also has an accelerating rate of adoption of new ordinances restricting siting. As a caveat, the NREL database does not have the adoption year for every ordinance, so this assessment is only using ordinances for which there is such data collected. And, similar to our finding with wind ordinances, as solar power becomes more common, so too do ordinances restricting it.
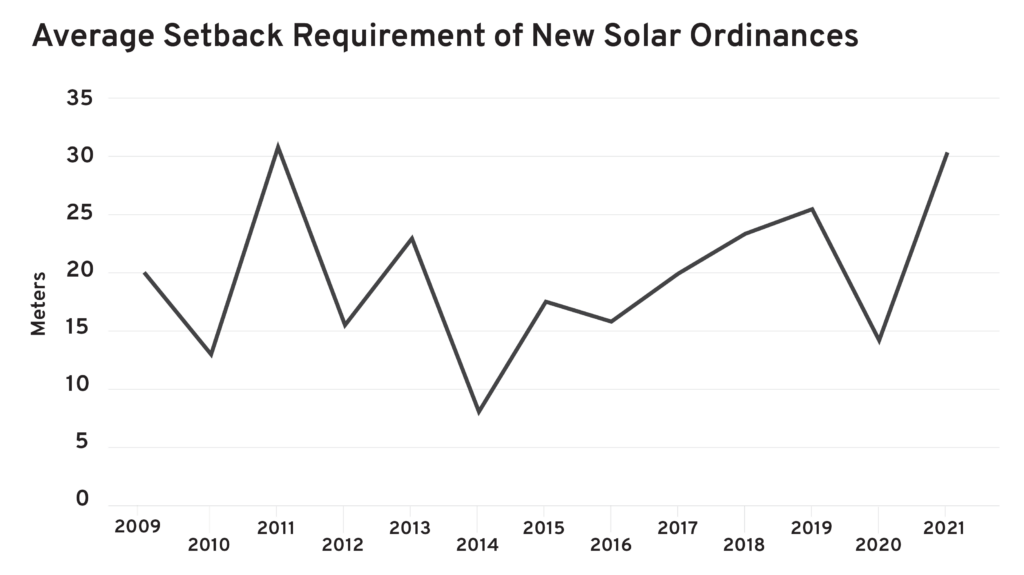
For wind ordinances, our analysis further found that the setback requirements for new ordinances was rising. For PV solar, though, that is not the case, with new ordinances having generally similar requirements to past ones, and on average having setback requirements under 50 meters.
While we expect more ordinances restricting PV solar deployment in the future, these ordinances would have to increase in their severity substantially to impede future PV deployment dramatically. This, though, is not a possibility to be discounted, as we did find in our analysis that the most prohibitive ordinances for new solar deployment were from 2019 onward.
Policy Insight
In our analysis of wind, we noted that “not in my back yard” attitudes likely explained much of the increase in ordinances for wind. This is likely the explaining factor for solar ordinances, and many counties that have solar ordinances also have wind ordinances. However, the generally less intrusive and visible nature of solar farms compared to wind farms is likely a major explanatory factor for solar ordinances being generally less restrictive.
What was of interest in our analysis, though, was that many ordinances governed the minimum or maximum size of solar installations, which allows counties to de facto prevent certain types of solar projects from being adopted—either community projects for being too small, or utility-scale ones for being too large. Since our analysis is focused on the restrictiveness of ordinances as determined by their setback requirements, we do not fully assess the potential for restrictions on the minimum or maximum size of solar facilities to act as de facto prohibitions against categories of solar facilities. This is likely the method that counties may use in the future to restrict the development of PV solar, if local attitudes are antagonistic to new development.
One underappreciated challenge with ordinances that restrict the deployment of new resources, even if the ordinances seem relatively benign, is that the optimal siting of renewable energy generation requires a balance of the technical generation potential based on the physical characteristics of the region, as well as proximity and access to transmission infrastructure. Our analysis did not determine if these ordinances have an undue level of restriction in preventing the optimal siting of PV solar, but it should be noted that simply because the ordinances we assessed still allow for large volumes of PV solar to be sited, that does not mean that what can be sited would be economically advantageous to build.
Another difference we found in comparing solar and wind ordinances is that there is not any one state or region that seems to have the most restrictive ordinances. For wind, we noted that Texas was both the state with the most wind generation and the most prohibitions of new wind siting, but there is not a corollary case for PV solar. This reinforces our general finding that local communities may be more tolerant of nearby solar farms than wind farms.
Conclusion
While state and local ordinances for PV solar have the potential to be highly constraining to future deployment, they have not materialized to date. And while many ordinances restricting PV solar are being adopted nationwide, the degree of restriction imposed by such ordinances is generally minimal. This is in stark contrast to wind ordinances, which are not only more commonplace but are also becoming more restrictive. Future challenges for state permitting of PV solar may not come in the form of setback restrictions, but on minimum or maximum facility sizes that preclude adoption of community solar projects, or utility-scale ones.

Series: State Energy Infrastructure Permitting and Siting Series
Meeting electricity demands over the nebxt few decades will require substantial infrastructure expansion throughout the energy sector. This new series surveys the challenges state and local permitting requirements pose to new energy infrastructure.