

Development of grey wolf optimization based modified fast terminal sliding mode controller for three phase interleaved … – Nature.com
Abstract
The conventional MPPT method has drawbacks, such as that under partial shading conditions, several peaks occur and identifying the global peak is difficult. It may converge to a local peak and lead to poor conversion efficiency and tracking efficiency. Implementation of a hybrid algorithm by integrating P&O and metaheuristic algorithms can perform better under partial shading conditions. But the tracking speed is low and the response time is longer. To mitigate the issues mentioned above, a new hybrid algorithm has been suggested that integrates GWO and a modified fast terminal sliding mode controller (MFTSMC). The suggested method with three phase ILBC is incorporated into the PV system. The MATLAB tool is employed to experiment with this study. The performance of GWO-MFTSMC is analysed through MATLAB/ SIMULINK and compared with the performance of ANN-FTSMC and PSO-FTSMC algorithm based MPPT techniques. A hardware prototype is developed and tested for 5 × 200 W solar PV modules with the GWO-MFTSMC algorithm. The proposed method conversion efficiency is 99.72% and 96.15% under simulation and hardware realisation, respectively, which is higher than the ANN-FTSMC and PSO-FTSMC methods.
Introduction
Several approaches are being utilised to maximise the energy from solar cells1,2,3. To improve the efficiency of the CdS/CdTe nanowire solar cell, Dang et al.4 used a transparent layer of molybdenum oxide 10 nm thick. However, to improve solar insolation gathering5,6,7,8 single and multiple axis solar trackers are used. Particle Swarm Optimization (PSO)9,10,11,12 is one of the most used MPPT methods. Motahhir et al.13 examine MPPT based on PV panel and power converter parameters. It is important that the P&O method has low implementation costs. This method can effectively handle both steady and dynamic environmental variables such as temperature and sun radiation14. Alik et al.15 also employ this approach due of its cheap cost, simplicity, and accuracy. Moshksar et al.16 suggested a novel MPPT algorithm to increase the installation’s performance. The three variants of perturb and observe algorithm was examined by Ramos-Hernanz et al.17. Others employ the incremental conductance control method, which accurately monitors PV module temperature and follows MPP without oscillations5. According to Chen et al.18, the behaviour of P&O has been enhanced by IC control method. To overcome the limitations of the traditional IC control algorithm, a novel IC controller based on fuzzy logic with direct control was developed. On the other hand, Ramos-Hernanz et al. Rezk et al.19–21 compared four different MPPTs like Perturb & Observe (P&O), Incremental Conductance (IC), Hill Climbing (HC) and Fuzzy Logic Controller (FLC). The methods utilised by Cortajarena et al.22 are HC, P&O, and SMC. Chaieb et al. suggested a novel MPPT-based approach that is both simple and effective.
The suggested technique combines the Simplified Accelerated Particle Swarm Optimization (SAPSO) algorithm with the conventional HC algorithm. The most common approaches are P&O and IC, says Li23,24. The P&O approach works effectively when the sun irradiation and temperature are stable. A simple analogue circuit or microprocessor can construct a low-cost P&O controller. However, this approach is slow to monitor the Maximum Power Point (MPP) and the power output oscillates around the maximum power point. Implementing IC control technique is difficult even though its performance is better than P&O algorithm. Due of their simplicity, P&O and IC control algorithms are used by Bayod-Rujula et al. In certain cases, like as fast changes in irradiance or partial shadowing of the installation, these algorithms are inefficient. Li et al.25,26 developed a MPPT control technique using Variable Climate Parameters (VWP) which will monitor the MPP more quickly. He compares developed algorithm with P&O and FLC. The Fast Terminal Sliding Mode Controller, the traditional Sliding Mode Controller and P&O algorithms were compared by Jamal et al.27. Controlling the MPPT in partial shade is one of the primary issues in PV systems. According to Mohapatra et al.28, the selection of MPPT control technique is depend on certain factors like application, cost, accuracy, convergence time, hardware availability and system dependability. The genetic method control algorithm was compared to perturb & observe algorithm and incremental conductance algorithm by Hadji et al.29,30.
Unlike Yatimi et al.31, who compared perturb & observe algorithm with sliding mode controller. Ramos-Hernanz et al.32 proposed a novel SMC-based control method. The algorithm’s performance was simulated and compared to actual testing. The simulated findings matched the experimental results well. MPPT may also use fuzzy logic-based controllers33,34. In this research, time delay voltages and currents are used. The link between variables is established or learned using fuzzy logic rules. Shahid et al.5 suggested an incremental conductance based indoor PV system method. The research used a temperature controller to transmit the solar photovoltaic panel temperatures and the focused light to Standard Test Conditions. MPPT technique based on variable step sized IC algorithm was added to the load side to provide higher power quality. To implement solar photovoltaic system in the outdoor, new MPPT algorithms were proposed and implemented35,36,37,38.
The consequence of temperature on maximum power point of solar panels was explored39,40,41 by Yadav et al.39 and Zahedi40. The band gap of the semiconductor material narrows as the PV material’s temperature rises, providing electrons greater energy. The decreased band gap increases the carrier and thereby reduces carrier mobility. They recombine on the opposite electrode. Recombination causes saturation current. To test the effect of open circuit voltage on solar cell temperature, Takur et al. Temperature increases with high light concentration in low concentration PV systems, as shown by Yadav et al.42. Yadav et al.42 studied the consequence of temperature on open circuit voltage of solar cell and maximum power point at various temperatures. To improve the efficiency of PV modules system and to improve the performance of a battery charge controller, salman et al.43 proposed a P&O based MPPT with microcontroller-based battery charge controller for 200 W standalone power generating station. To improve the performance of power generation using photovoltaic modules S Senthilkumar et al.44 compared the optimization techniques which involve PSO, GA, BAT and GWO. K Krishnaram et al.45,46 proposed a novel hybrid MPPT technique which involves WCO-P&O method and ANN-ASSPO method. This method has improved the tracking and conversion performance. But still improvement is required in settling time and in conversion efficiency when PV panels are subjected to partial shading conditions.
Therefore, this article presents a novel hybrid MPPT algorithm which combines GWO and Modified Fast Terminal Sliding Mode Controller (GWO-MFTSMC). Comparative analysis has been done in this work with different optimization MPPT algorithms such as ANN and PSO. The findings of a computer simulation (MATLAB/SIMULINK) are used to compare the proficiency of the PV system called a standard PV array with uniform solar irradiation simulation. The PV system operates in two separate hardware prototype of PV array operating in two scenarios for partial shading. The paper is structured accordingly; Section “Proposed GWO-MFTSMC system” and the simulation results in section “Results and Discussion” along with hardware model. In addition, there is also a presentation on the effectiveness of the MPPT algorithms and the comparative analysis. Finally, Section “MPPT charge controller hardware” deals with the conclusions.
Proposed GWO-MFTSMC system
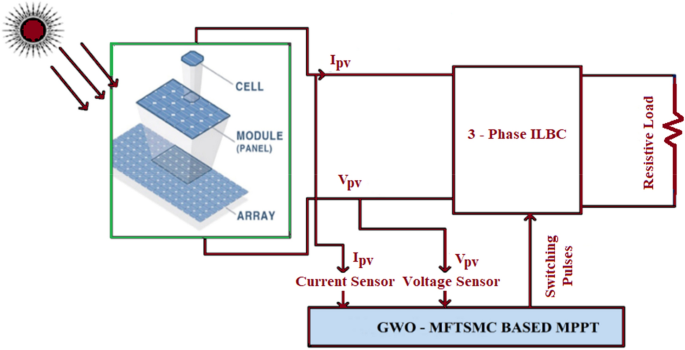
The GWO-MFTSMC based PV system block diagram is shown in Fig. 1. The circuit description and modelling are described in detail.
The design equations of interleaved boost converter are as follow:
where Vo & Vin are output and input voltages and D is duty ratio
The Simulink diagram shown in the Fig. 2 has PV modules, three phase interleaved boost converter with GWO-MFTSMC based MPPT algorithm. Since it ILBC is used, the output voltage is always greater than input voltage which is based on the duty ratio. The proposed circuit has MOSFET switches which are turned on with 120° phase difference since it has only three phases. The switching frequency for the proposed system is 20 kHz. The value of inductors and capacitor are 120 μH and 300 μF respectively. For the PV system shown above, load resistance is assumed as 10 ohms. The input voltage is obtained from PV modules and output is fed to the load resistance which is assumed as standalone load. The flowchart of the GWO-MFTSMC algorithm implemented for the charge controller is given in Fig. 3. Table 1 shows the specifications of PV panel chosen which is Bosch Solar Energy c-Si M72NA41126 300 WP.
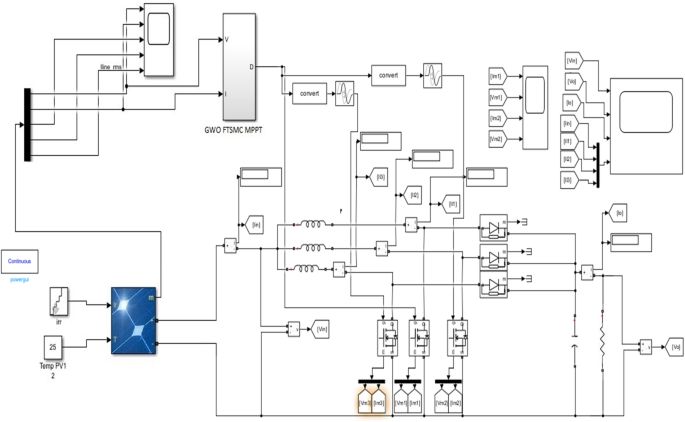
Simulink diagram of proposed GWO-MFTSMC.
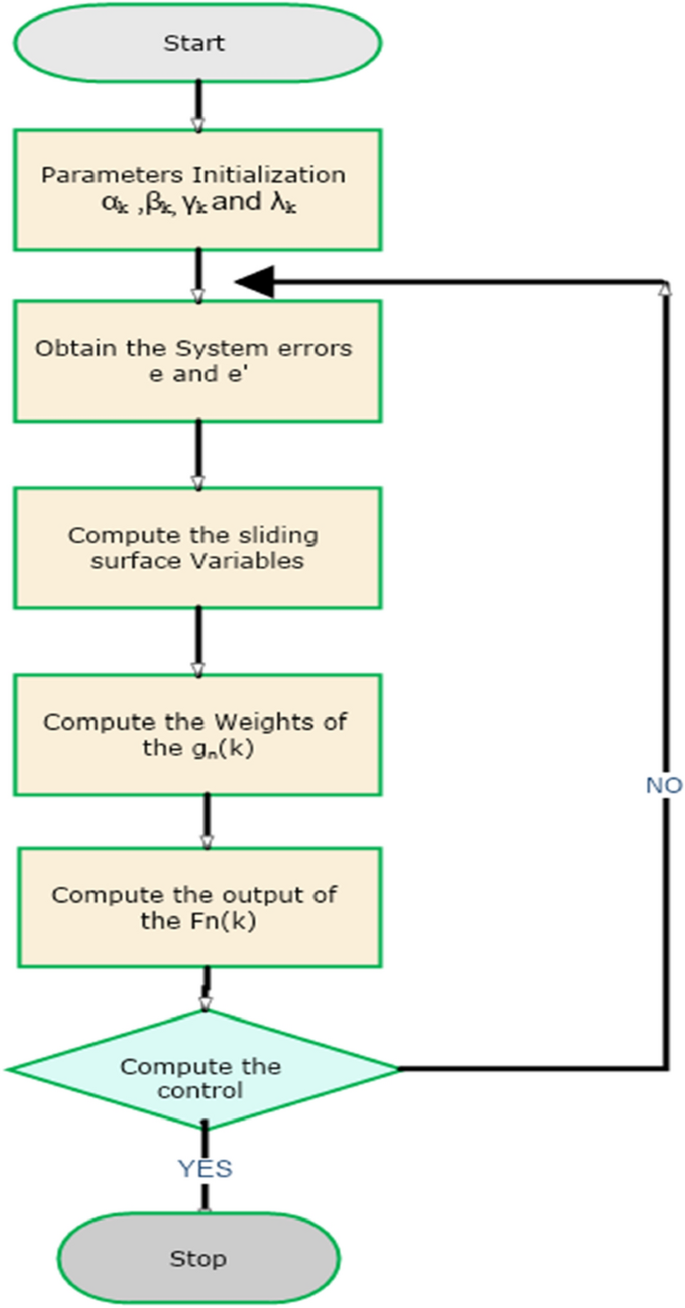
Flowchart of GWO-MFTSMC based MPPT.
The suggested MPPT technique involves calculating and updating the fitness value or position of grey wolves. If the grey wolves’ position coincides with that of their prey, it can be inferred that the algorithm has reached the global peak. In the proposed GWO-MFTSMC, the presence of modified fast terminal sliding mode controller reduces the oscillations around GMPP and makes the system to settle quickly. If the new power value (Pnew) is higher than the old power value (Pold), the pulse width modulation (PWM) duty cycle is raised to maximize the power extraction from the photovoltaic array. If Pnew is lower than Pold, the duty cycle is decreased to restore the system to its prior highest power.
The maximum power point algorithm, when paired with a controller, is characterized by its, ease of implementation, simplicity, low cost, and high level of precision. The MFTSM switching technique entails the adjustment of a collection of unspecified parameters αk, βk, γk, and λk, as depicted in Fig. 3. The selection of these operational limits is a challenging and takes more time. Due to the diminishing effectiveness of the iterative trial-and-error processes, the tuning problem is reformulated as a restricted optimization program.
Ethical approval
This paper does not contain any studies with human participants or animals performed by any of the authors.
Results and discussion
The GWO-MFTSMC based MPPT algorithm has been simulated using MATLAB/Simulink. Three phase ILBC has been used as a power converter with 0.5 as duty ratio with voltage conversion rate is 2. To analyse the proposed system performances, two hybrid algorithms PSO-FTSMC and ANN-FTSMC were simulated and compared with proposed system. Six PV panels were used in the PV array. The efficiencies are determined according to the measured power at output and input. The implementation of the GWO-MFTSMC MPPT charge controller significantly enhances the efficiency. In PSO based MPPT, each position is updated regularly which enables to track its position and fitness value in search area to get better solution. In each interaction, particle velocity and position are updated which yields best solution locally and globally. The proposed system performances were tested under three different cases with rapidly changing irradiance. The three test cases were mentioned in the Table 2. These three cases demonstrates the PV system performance under partial shading / rapidly changing weather conditions.
-
(i)
Case I
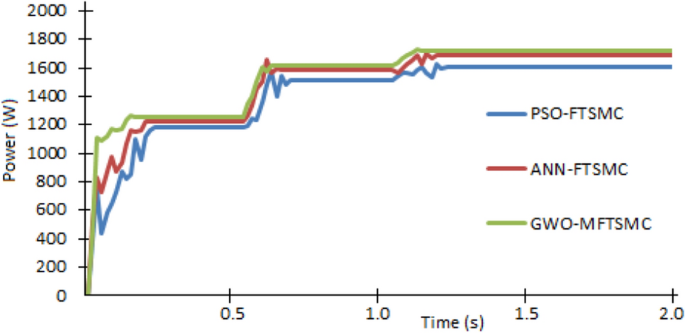
Initially six PV panels were received 600 W/m2 and later it has been increased to 850 W/m2 and 950 W/m2 with constant temperature. From the Fig. 4 it can be observed that more power fluctuations when the irradiance level is at 600 W/m2. The peak power which can be obtained from PV array is 1080 W. the power delivered by PV panels through PSO-FTSMC is 998 W, ANN-FTSMC is 1053 W and GWO-FTSMC is 1069 W. The power conversion efficiency is more in GWO-MFTSMC (98.99%) than PSO-FTSMC (92.46%) and ANN-FTSMC(97.48%). Figures 5 and 6 shows that oscillations are less in PV’s output voltage and current respectively using GWO-MFTSMC technique.
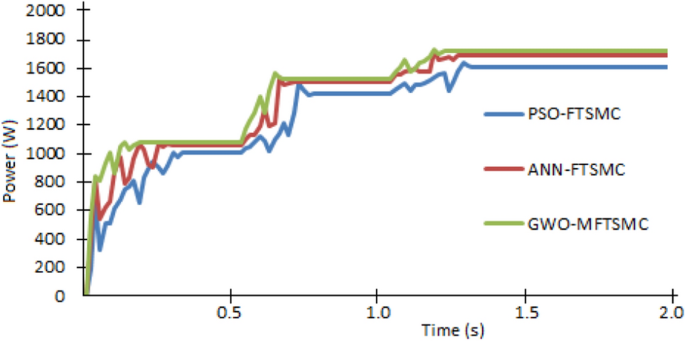
Comparison of PV’s power output from PSO-FTSMC, ANN-FTSMC and GWO-MFTSMC in Case I.
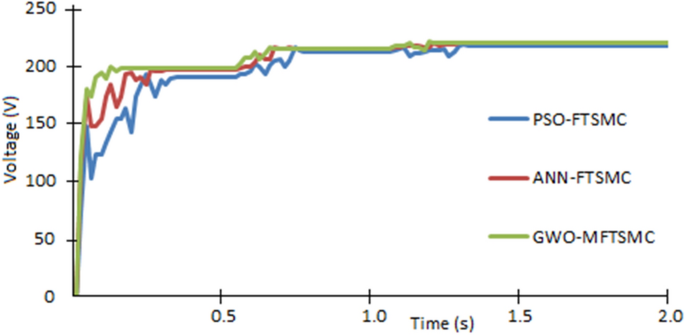
Comparison of PV’s output voltage from PSO-FTSMC, ANN-FTSMC and GWO-MFTSMC in Case I.
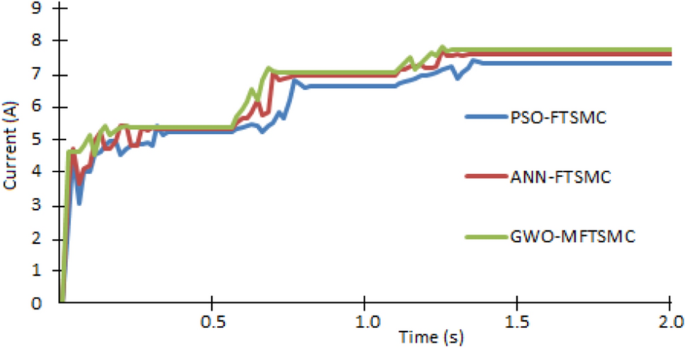
Comparison of PV’s output current from PSO-FTSMC, ANN-FTSMC and GWO-MFTSMC in Case I.
When the irradiance levels are changed from 600 to 850 W/m2, the power generated from PV array has been increased from 998 to 1418 W in PSO-FTSMC technique. Similarly ANN-FTSMC has increased power from 1053 to 1499 W and GWO-MFTSMC has increased from 1069 to 1520 W. The conversion efficiency has also improved in all three techniques in which the proposed technique GWO-MFTSM has conversion efficiency of 99.39%. The output voltage, current and power values at three irradiance levels are shown in the Table 3.
-
(ii)
Case II
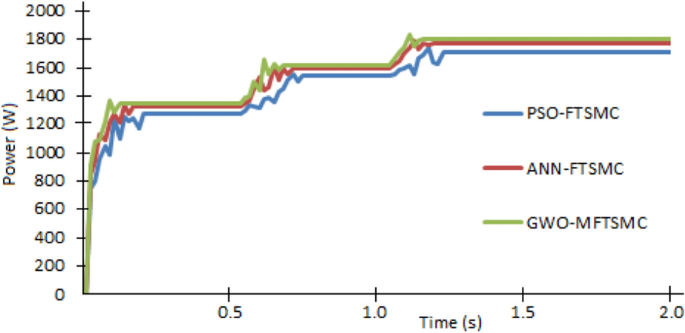
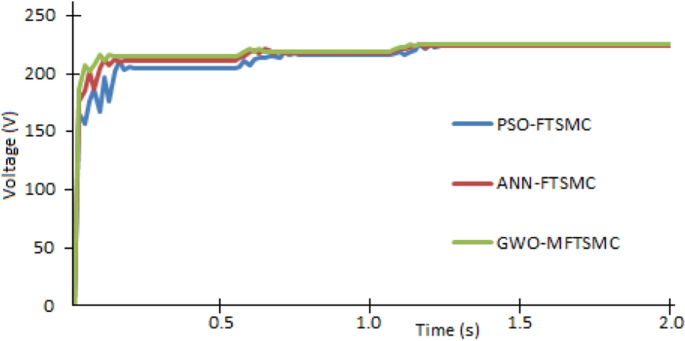
In this case, irradiance levels were changed from 700 to 900 W/m2 and 950 W/m2. The temperature is maintained constant. The Fig. 7 depicts that oscillations are reduced in GWO-MFTSMC than PSO-FTSMC and ANN-FTSMC technique. The peak power which can be obtained from PV array is 1260 W when irradiance is 700 W/m2 1620 W when irradiance is 900 W/m2 and 1710 W when irradiance is 950 W/m2. The power generated from PV array when irradiance at 700 W/m2 through PSO-FTSMC is 1173 W, ANN-FTSMC is 1221 W and GWO-FTSMC is 1246 W. The power conversion efficiency is more in GWO-MFTSMC (98.89%) than PSO-FTSMC (93.11%) and ANN-FTSMC (96.96%). Figures 8 and 9 shows that oscillations are less in PV’s output voltage and current respectively using GWO-MFTSMC technique.
Comparison of PV’s power output from PSO-FTSMC, ANN-FTSMC and GWO-MFTSMC in Case II.
Comparison of PV’s output voltage from PSO-FTSMC, ANN-FTSMC and GWO-MFTSMC in Case II.
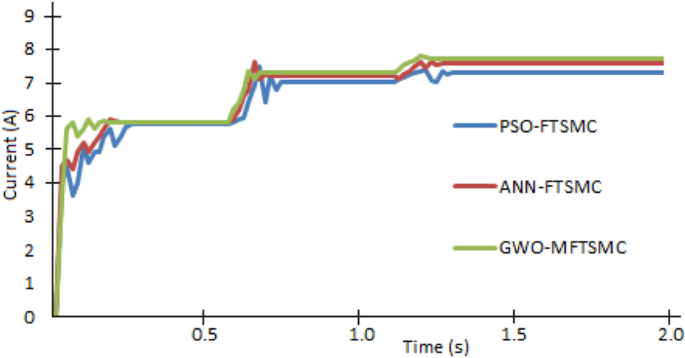
Comparison of PV’s output current from PSO-FTSMC, ANN-FTSMC and GWO-MFTSMC in Case II.
When the irradiance levels are changed from 700 to 900 W/m2, the power generated from PV array has been increased from 1173 to 1512 W in PSO-FTSMC technique. Similarly ANN-FTSMC has increased power from 1221 to 1577 W and GWO-MFTSMC has increased from 1246 to 1607 W. The conversion efficiency has also improved in all three techniques in which the proposed technique GWO-MFTSM has conversion efficiency of 99.24%. The output voltage, current and power values at three irradiance levels are shown in the Table 4.
-
(iii)
Case III
Irradiance levels were changed from 750 to 900 W/m2 and 100 W/m2. The temperature is maintained constant. The peak power obtained from PV array is 1350 W when irradiance is 750 W/m2, 1620 W when irradiance is 900 W/m2 and 1800 W when irradiance is 1000 W/m2. The power generated from PV array when irradiance at 750 W/m2 through PSO-FTSMC is 1265 W, ANN-FTSMC is 1316 W and GWO-FTSMC is 1339 W. The power conversion efficiency is more in GWO-MFTSMC (99.18%) than PSO-FTSMC (93.37%) and ANN-FTSMC (97.52%). Figures 10, 11 and 12 shows that oscillations are less in PV’s output power, voltage and current respectively using GWO-MFTSMC technique.
Comparison of PV’s power output from PSO-FTSMC, ANN-FTSMC and GWO-MFTSMC in Case III.
Comparison of PV’s output voltage from PSO-FTSMC, ANN-FTSMC and GWO-MFTSMC in Case III.
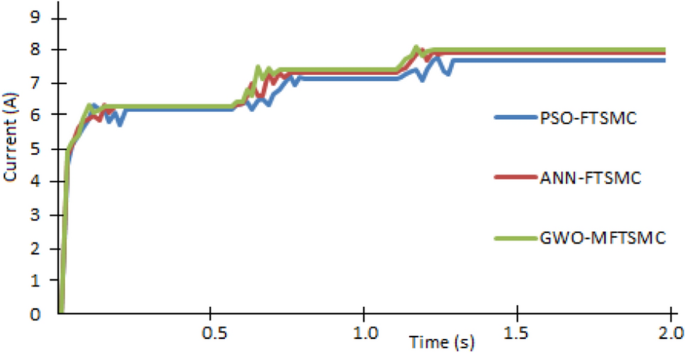
Comparison of PV’s output current from PSO-FTSMC, ANN-FTSMC and GWO-MFTSMC in Case III.
When the irradiance levels are changed from 750 to 900 W/m2, the power generated from PV array has been increased from 1265 to 1534 W in PSO-FTSMC technique. Similarly ANN-FTSMC has increased power from 1221 to 1577 W and GWO-MFTSMC has increased from 1316 to 1586 W. The conversion efficiency has also improved in all three techniques in which the proposed technique GWO-MFTSM has conversion efficiency of 99.5%. The output voltage, current and power values at three irradiance levels are shown in the Table 5. When irradiance changed from 900 to 1000 W/m2 the conversion efficiency of GWO-MFTSMC has increased from 99.50 to 99.75%.
The values of power, conversion efficiency and settling time obtained in different MPPT techniques under all three cases are tabulated in Table 6.
MPPT charge controller hardware
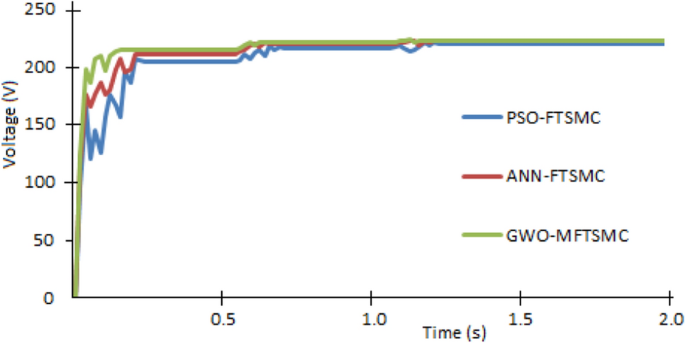
The suggested photovoltaic (PV) system entails the development of a MPPT charge controller utilizing an ILBC and a microcontroller. The functionality of a prototype charge controller is evaluated using a series connected 5 × 200 W photovoltaic panels. The implemented MPPT controller enhances the efficiency of the PV panel in comparison to traditional charge controllers. The charge controller is designed using software called Altium Designer. The depicted hardware illustrated in Fig. 13. The GWO-MFTSMC MPPT charge controller, which has been created, is linked among a photovoltaic module and a lead acid battery, adhering to the parameters provided in Table 7. The initial assessment involves the computation of the generated power by the photovoltaic module and the MPPT controller. The Figs. 14, 15 and 16 display the measured output parameters of the MPPT controller. Throughout the experiments, the weather conditions consisted of intermittent cloud cover, resulting in fluctuating output from the photovoltaic module. The output power of MPPT controller is mostly determined by the PWM duty cycle. In order to assess the performance of the controllers under varying weather conditions, three sets of experiments based on PSO-FTSMC, ANN-FTSMC and GWO-MFTSMC have been performed between 2 pm and 3:30 pm. Comparison of conversion efficiency and settling time of PSO-FTSMC, ANN-FTSMC and GWO-MFTSMC based MPPTS at various irradiance level are shown in Table 8. Conversion efficiency and settling time comparison for all three MPPTs are shown in Figs. 17 and 18.
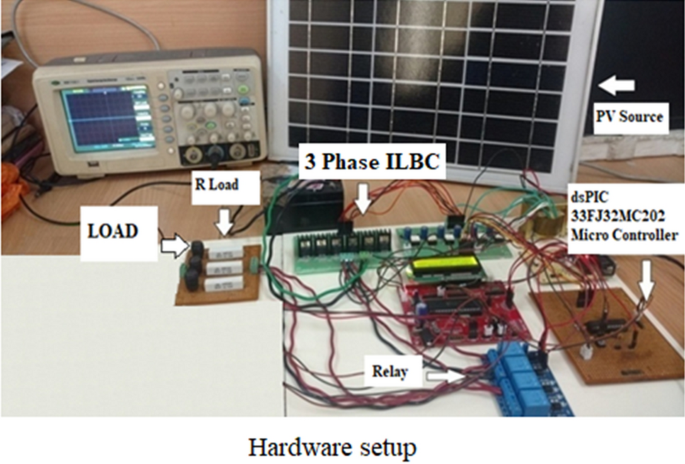
Hardware setup.
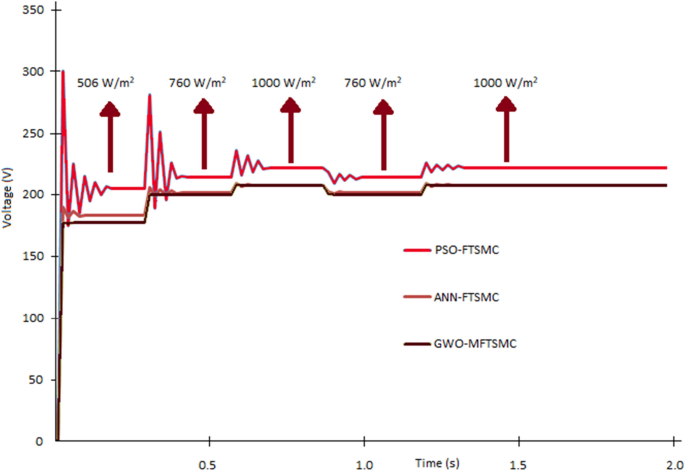
Comparison of PV’s output voltage for all three MPPTS based on hardware results.
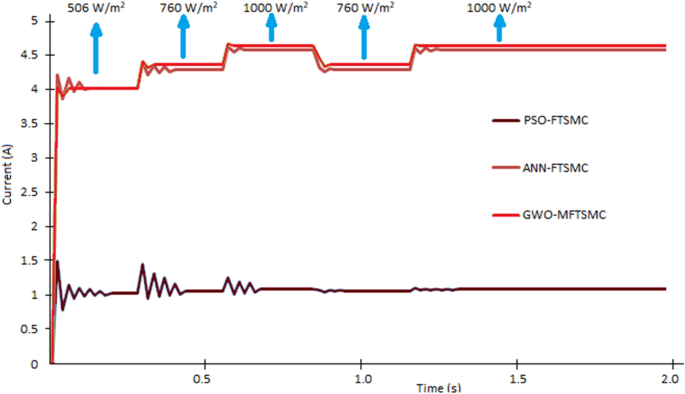
Comparison of PV’s output current for all three MPPTS based on hardware results.
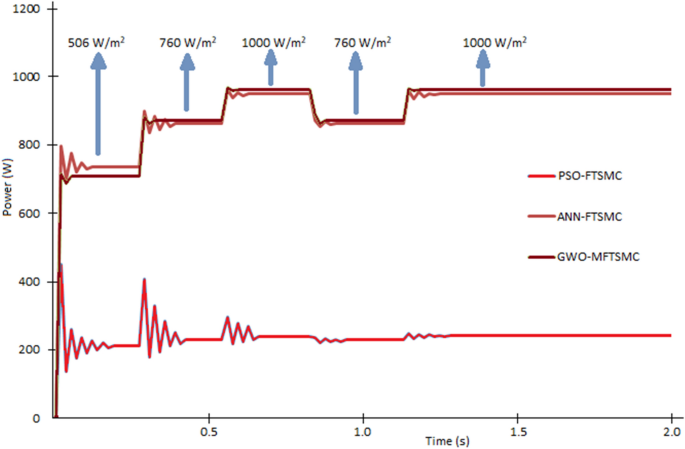
Comparison of PV’s output power for all three MPPTS based on hardware results.
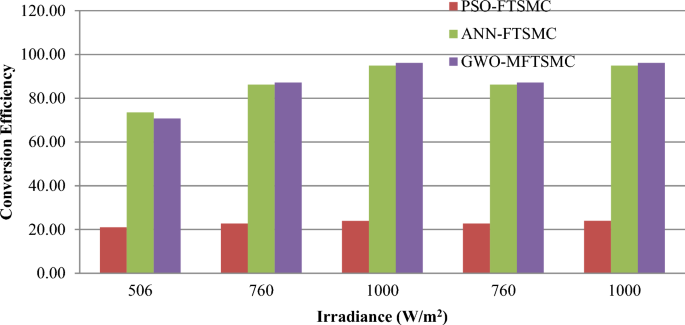
Conversion efficiency of PSO-FTSMC, ANN-FTSMC and GWO-MFTSMC at various irradiance levels (Table 8).
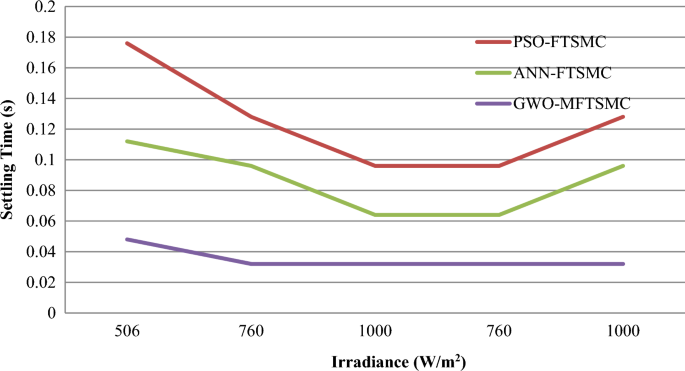
Settling time of PSO-FTSMC, ANN-FTSMC and GWO-MFTSMC at various irradiance levels (Table 8).
Conclusion
The hybrid GWO-MFTSMC technique has been proposed for a PV system with three phase ILBC. A comparison between the GWO-MFTSMC algorithm, PSO-FTSMC and ANN-FTSMC algorithm has been done in simulation and in hardware realization. Both simulation results and hardware reveals that the GWO-MFTSMC algorithm offers superior efficiency and reliability in tracking power from 6 × 300 (simulation) and 5 × 200 W (hardware realization) photovoltaic modules, particularly in situations with rapid fluctuations in irradiance. The experimental outcomes shown that the proposed system is dominating in terms of efficiency (99.72% and 96.15% in simulation and in hardware realization respectively) compared to the conventional design. The settling time is also very less for proposed method (0.096s in simulation and 0.0352s in hardware realization) than conventional PSO-FTSMC and ANN-FTSMC methods.
Data availability
The datasets used and/or analysed during the current study are available from the corresponding author upon reasonable request.
Abbreviations
- MPPT:
-
Maximum power point tracking
- PV:
-
Photovoltaic
- FTSMC:
-
Fast terminal sliding mode controller
- MFTSMC:
-
Modified fast terminal sliding mode controller
- GWO:
-
Grey wolf optimization
- P&O:
-
Perturb & observe
- HC:
-
Hill climbing
- IC:
-
Incremental conductance
- PSO:
-
Particle swarm optimization
- FLC:
-
Fuzzy logic controller
- VWP:
-
Variable climate parameters
- ANN:
-
Artificial neural network
References
-
Kulaksiz, A. A. & Akkaya, R. A genetic algorithm optimized ANN-based MPPT algorithm for a stand-alone PV system with induction motor drive. Sol. Energy 86, 2366–2375 (2020).
-
Manuel Lopez-Guede, J., Antonio Ramos-Hernanz, J., Zulueta, E., Fernandez-Gamiz, U. & Oterino, F. Systematic modeling of photovoltaic modules based on artifcial neural networks. Int. J. Hydrogen Energy 41, 12672–12687 (2016).
-
Shahid, H. Design and modeling of an optical band gap matched temperature controlled indoor concentrated light transmission system for photovoltaic energy production. Optik 176, 502–511 (2020).
-
Dang, H. & Singh, V. P. Nanowire CdS-CdTe solar cells with molybdenum oxide as contact. Sci. Rep. 5, 14859 (2015).
-
Shahid, H. Implementation of the novel temperature controller and incremental conductance MPPT algorithm for indoor photovoltaic system. Sol. Energy 163, 235–242 (2018).
-
Putri, R. I., Wibowo, S., Rifa’I, M. Maximum power point tracking for photovoltaic using incremental conductance method. in 2nd International Conference on Sustainable Energy Engineering and Application, ICSEEA 2014 Sustainable Energy for Green Mobility vol 68, pp 22–30. (2014)
-
Kumar K K, Bhaskar R, Koti H. Implementation of MPPT algorithm for solar photovoltaic cell by comparing short-circuit method and incremental conductance method. in 7th International Conference Interdisciplinarity in Engineering (Inter-Eng 2013) vol 12, pp 705–715 (2013).
-
Kamran, M. Implementation of improved Perturb & Observe MPPT technique with confned search space for standalone photovoltaic system. J. King Saud Univ. Eng. Sci.
-
Anto, E. K., Asumadu, J. A. & Okyere, P. Y. PID Control for Improving P&O-MPPT Performance of a Grid-Connected Solar PV System With Ziegler-Nichols Tuning Method. Proceedings of the 2016 Ieee 11th Conference on Industrial Electronics and Applications (Iciea) pp 1847–1852 (2016).
-
Sahnoun, M. A., Ugalde, H. M. R., Carmona, J. & Gomand, J. Maximum power point tracking using P&O control optimized by a neural network approach: A good compromise between accuracy and complexity. In: Mediterranean Green Energy Forum 2013: Proceedings of an International Conference Mgef-13 vol. 42, pp. 650–659 (2013).
-
Faizal, A., Sutoyo, R., Mulyono, A. & Yendra, F. Design maximum power point tracking (MPPT) on photovoltaic panels using fuzzy logic method. Am. J. Eng. Appl. Sci. 9, 789–797 (2016).
-
Mao, M. A two-stage particle swarm optimization algorithm for MPPT of partially shaded PV arrays. Int. J. Green Energy 14, 694–702 (2017).
-
Motahhir, S., El Hammoumi, A. & El Ghzizal, A. The most used MPPT algorithms: Review and the suitable low-cost embedded board for each algorithm. J. Clean. Prod. 246, 118983 (2020).
-
Devi, V. K., Premkumar, K., Beevi, A. B. & Ramaiyer, S. A modifed Perturb & Observe MPPT technique to tackle steady state and rapidly varying atmospheric conditions. Sol. Energy 157, 419–426 (2017).
-
Alik, R. & Jusoh, A. An enhanced P&O checking algorithm MPPT for high tracking efciency of partially shaded PV module. Sol. Energy 163, 570–580 (2018).
-
Moshksar, E. & Ghanbari, T. A model-based algorithm for maximum power point tracking of PV systems using exact analytical solution of single-diode equivalent model. Sol. Energy 162, 117–131 (2018).
-
Ramos-Hernanz, J. In International Conference on Technical and Physical Problems of Electrical Engineering. (2016).
-
Chen, Y., Lai, Z. & Liang, R. A novel auto-scaling variable step-size MPPT method for a PV system. Sol. Energy 102, 247–256 (2014).
-
Radjai, T., Rahmani, L., Mekhilef, S. & Gaubert, J. P. Implementation of a modifed incremental conductance MPPT algorithm with direct control based on a fuzzy duty cycle change estimator using dSPACE. Sol. Energy 110, 325–337 (2020).
-
Ramos-Hernanz, J. A. Study of the behavior of the Incremental Conductance algorithm for MPPT. In 2016 8th International Conference on Electronics, Computers and Artifcial Intelligence (ECAI). (2016).
-
Rezk, H. & Eltamaly, A. M. A comprehensive comparison of diferent MPPT techniques for photovoltaic systems. Sol. Energy 112, 1–11 (2020).
-
Cortajarena, J. A., Barambones, O., Alkorta, P. & De Marcos, J. Sliding mode control of grid-tied single-phase inverter in a photovoltaic MPPT application. Sol. Energy 155, 793–804 (2020).
-
Chaieb, H. & Sakly, A. A novel MPPT method for photovoltaic application under partial shaded conditions. Sol. Energy 159, 291–299 (2018).
-
Li, S. A MPPT control strategy with variable weather parameter and no DC/DC converter for photovoltaic systems. Sol. Energy 108, 117–125 (2020).
-
Bayod-Rujula, A. & Cebollero-Abian, J. A novel MPPT method for PV systems with irradiance measurement. Sol. Energy 109, 95–104 (2020).
-
Li, S., Liao, H., Yuan, H., Ai, Q. & Chen, K. A MPPT strategy with variable weather parameters through analyzing the efect of the DC/DC converter to the MPP of PV system. Sol. Energy 144, 175–184 (2017).
-
El Khazane, J. & Tissir, E. H. Achievement of MPPT by fnite time convergence sliding mode control for photovoltaic pumping system. Sol. Energy 166, 13–20 (2018).
-
Mohapatra, A., Nayak, B., Das, P. & Mohanty, K. B. A review on MPPT techniques of PV system under partial shading condition. Renew. Sustain. Energy Rev. 80, 854–867 (2020).
-
Hadji, S., Gaubert, J. & Krim, F. Theoretical and experimental analysis of genetic algorithms based MPPT for PV systems. in International Conference on Technologies and Materials for Renewable Energy, Environment and Sustainability-TMREES15. Vol 74, pp 772–787 (2015).
-
Ramos-Hernanz, J., Manuel Lopez-Guede, J., Barambones, O., Zulueta, E. & Fernandez-Gamiz, U. Novel control algorithm for MPPT with boost converters in photovoltaic systems. Int. J. Hydrogen Energy 42, 17831–17855 (2017).
-
Yatimi, H. & Aroudam, E. MPPT algorithms based modeling and control for photovoltaic system under variable climatic conditions. in 11th International Conference Interdisciplinarity in Engineering, Inter-Eng. vol 22, pp 757–764 (2017).
-
Ramos-Hernanz, J. A. Sliding mode real-time control of photovoltaic systems using neural estimators. Int. J. Photoenergy 5214061.
-
Kwan, T. H. & Wu, X. Maximum power point tracking using a variable antecedent fuzzy logic controller. Sol. Energy 137, 189–200 (2016).
-
Chen, Y., Jhang, Y. & Liang, R. A fuzzy-logic based auto-scaling variable step-size MPPT method for PV systems. Sol. Energy 126, 53–63 (2020).
-
El Bahir, L. & Hassboun, T. Accurate Maximum power point tracking algorithm based on a photovoltaic device model. Int. J. Photoenergy 5693941.
-
Farahat, M. A., Enany, M. A. & Nasr, A. Assessment of maximum power point tracking techniques for photovoltaic system applications. J. Renew. Sustain. Energy 7, 042702 (2015).
-
Hong, Y. Efficient maximum power point tracking for a distributed PV system under rapidly changing environmental conditions. IEEE Trans. Power Electron. 30, 4209–4218 (2020).
-
Bhatnagar, A. P. & Nema, B. R. K. Conventional and global maximum power point tracking techniques in photovoltaic applications: A review. J. Renew. Sustain. Energy 5, 032701 (2013).
-
Yadav, P., Tripathi, B., Lokhande, M. & Kumar, M. Estimation of steady state and dynamic parameters of low concentration photovoltaic system. Solar Energy Mater. Solar Cells. 112, 65–72 (2020).
-
Zahedi, A. Review of modelling details in relation to low-concentration solar concentrating photovoltaic. Renew. Sustain. Energy Rev. 15, 1609–1614 (2011).
-
Takur, A. K., Wantz, G., Garcia-Belmonte, G., Bisquert, J. & Hirsch, L. Temperature dependence of open-circuit voltage and recombination processes in polymer-fullerene based solar cells. Solar Energy Mater. Solar Cells. 95, 2131–2135 (2020).
-
Yadav, A. S., Pachauri, R. K. & Chauhan, Y. K. Comprehensive investigation of PV arrays with puzzle shade dispersion for improved performance. Sol. Energy 129, 256–285 (2020).
-
Salman, S., Al, X. & Zhouyang, W. U. Design of a P-&-O algorithm based MPPT charge controller for a stand-alone 200W PV system. Prot. Control Modern Power Syst. https://doi.org/10.1186/s41601-018-0099- (2018).
-
Senthilkumar, S., Mohan, V., Mangaiyarkarasi, S. P. & Karthikeyan, M. Analysis of single-diode PV model and optimized MPPT model for different environmental conditions. Int. Trans. Electr. Energy Syst. 4980843, 1–17 (2022).
-
Krishnaram, K. & Suresh Padmanabhan, T. A water cycle approach for maximum power point tracking through an interleaved boost converter. Electr. Power Comp. Syst. 51(20), 2474–2486 (2023).
-
Krishnaram, K., Padmanabhan, T. S., Alsaif, F. & Senthilkumar, S. Performance optimization of interleaved boost converter with ANN supported adaptable stepped-scaled P&O based MPPT for solar powered applications. Sci. Rep. 14(8115), 1–17 (2024).
Acknowledgements
We would like to thanks to E.G.S. Pillay Engineering College, Nagapattinam, Tamil Nadu, India for supporting to this research work. In addition, this work was supported by the Researchers Supporting Project number (RSPD2024R646), King Saud University, Riyadh, Saudi Arabia.
Author information
Authors and Affiliations
Contributions
All authors contributed to the study, conception, and design. all authors commented on the manuscript. All authors read and approved the final manuscript. Authors transfer to Springer the publication rights and warrant that our contribution is original.
Corresponding author
Ethics declarations
Competing interests
The authors declare no competing interests.
Additional information
Publisher’s note
Springer Nature remains neutral with regard to jurisdictional claims in published maps and institutional affiliations.
Rights and permissions
Open Access This article is licensed under a Creative Commons Attribution 4.0 International License, which permits use, sharing, adaptation, distribution and reproduction in any medium or format, as long as you give appropriate credit to the original author(s) and the source, provide a link to the Creative Commons licence, and indicate if changes were made. The images or other third party material in this article are included in the article’s Creative Commons licence, unless indicated otherwise in a credit line to the material. If material is not included in the article’s Creative Commons licence and your intended use is not permitted by statutory regulation or exceeds the permitted use, you will need to obtain permission directly from the copyright holder. To view a copy of this licence, visit http://creativecommons.org/licenses/by/4.0/.
About this article
Cite this article
Krishnaram, K., Suresh Padmanabhan, T., Alsaif, F. et al. Development of grey wolf optimization based modified fast terminal sliding mode controller for three phase interleaved boost converter fed PV system.
Sci Rep 14, 9256 (2024). https://doi.org/10.1038/s41598-024-59900-z
-
Received: 04 April 2024
-
Accepted: 16 April 2024
-
Published: 22 April 2024
-
DOI: https://doi.org/10.1038/s41598-024-59900-z
Keywords
Comments
By submitting a comment you agree to abide by our Terms and Community Guidelines. If you find something abusive or that does not comply with our terms or guidelines please flag it as inappropriate.