Maximise yield of solar PV plant with 30 years of site-specific data – Solargis – PV Tech
Some notable solar projects started operational in Southeast Asia last year. For example, the Indonesian state utility PLN and UAE state-run renewables developer Masdar inaugurated the 145MWac (192MWp) Cirata floating solar PV (FPV) plant in the West Java province of Indonesia.
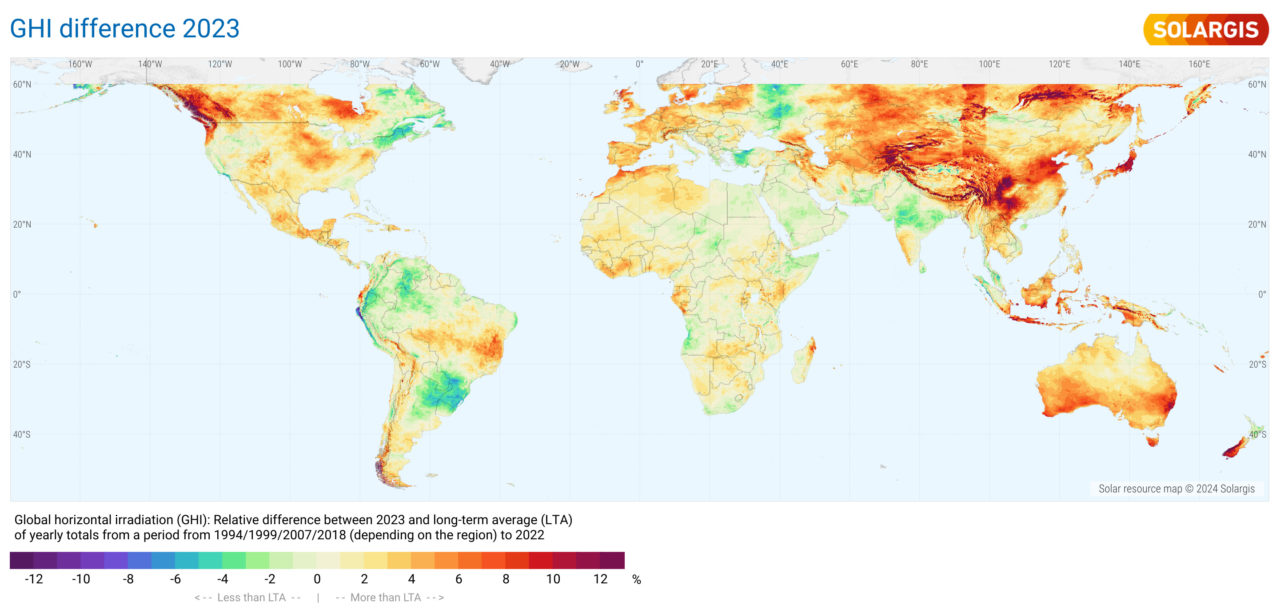
Europe also had higher than average solar irradiance, particularly in southern Nordic regions, with most regions on the continent exceeding their long-term average by between 1% and 7%. Solargis said it was due to reduced cloudiness and rainfall.
“(But) it is probably still not possible to predict with reasonable confidence that solar radiation levels over a longer period of time from months to seasons,” says Marcel Suri, CEO of Solargis.
That means last year’s high-level solar irradiance in Southeast Asia does not guarantee the same phenomenon will occur in the same region in 2024.
However, solar developers still have useful data to rely on. “The European Centre for Medium-Range Weather Forecast (ECMWF) runs models with a focus on air temperature and precipitation, although the uncertainty is much higher, compared to short-term forecasts,” Suri says.
According to ECMWF, it produces “operational ensemble-based analyses and predictions that describe the range of possible scenarios and their likelihood of occurrence”. Its forecasts can cover up to a year ahead.
Although higher solar irradiance can increase power output from a solar PV plant, there are still some important factors that solar developers need to consider before development.
First, high solar irradiance can lead to increased resource variability in tropical climates, and higher irradiance can increase the air temperature and, therefore, the rate of evaporation, which can produce scattered clouds that reduce the solar irradiance at ground level.
“Higher solar radiation means higher air temperature, and in hot climates higher temperature can reduce the efficiency of inverters. Inverters contain a temperature overloading protection system, whereby the inverter will reduce its output to protect itself from overheating when the internal temperature rises to about 40-50°C. Therefore, the overall expected power output will be lower than in the original design,” Suri says.
Moreover, solar PV modules will be subjected to more extreme temperature ranges between day and night in a hot climate.
Suri says: “Each material has its own expansion coefficient and with higher temperature changes, higher dimension changes can occur. These micro-movements result in a faster rate of mechanical degradation of materials since they are put under greater strain.”
Additionally, sudden temperature evolution from early morning to noon could increase the accumulation of dew on cold surfaces. As a result, PV modules may be sticky and accumulate more dust, causing steel parts to rust.
Also, wet surfaces that come into contact with electronic components are more likely to fail due to problems such as an increased risk of short-circuiting.
Using suitable data for development
Although there are a lot of problems that solar developers need to take note of when developing solar PV plants in regions with high solar irradiance, they can use site-specific data of up to 30 years including solar radiation and air temperature to show the historical trends during the design phase of a solar PV plant.
Moreover, solar developers can use sub-hourly time series data instead of hourly typical meteorological year data. Time series data – for example, at a resolution of 15-minute intervals – uses high frequency collection to pinpoint temperature variability and improve the resultant accuracy of modelling. For simulation and future estimation, it can provide a dramatically clearer picture of the existing and anticipated performance of a PV power plant.
On the contrary, typical meteorological year datasets, which only show long-term annual averages, allow solar operators and investors to monitor and analyse multiple parameters to elevate the operation and output of their PV technology. These include wind speed, direction, relative humidity, and rainfall.
“Time series also makes it possible to analyse solar PV power production under extreme weather conditions, such as high and low temperature, and evaluate risks related to strong wind, high humidity, high temperature, and heavy rainfalls. In solar PV energy simulation, time series data provides a dramatically better understanding of the existing and anticipated performance of a solar PV power plant,” Suri says.
Aside from the types of data, solar PV developers also need to use validated data from trusted sources and improve the accuracy of the satellite-model data with solar measurements.
Last but not least, Solargis adds that extreme weather events impacted the energy sector in multiple ways last year, including a lack of water in hydropower plants and an increase in energy demand for cooling.
“Global atmospheric and ocean processes are complex and can rapidly change, therefore it is difficult to make assumptions for 2024. Solar performance continues to demonstrate a high level of reliability when faced with extreme air temperature and this highlights the important role PV plays in the energy grids,” says Suri.


