Numerical study on solar photovoltaic/thermal system with tesla valve | Scientific Reports – Nature.com
Abstract
In recent years, photovoltaic/thermal (PV/T) systems have played a crucial role in reducing energy consumption and environmental degradation, nonetheless, the low energy conversion efficiency presents a considerable obstacle for PV/T systems. Therefore, improving heat conversion efficiency is essential to enhance energy efficiency. In this paper, the PV/T system with the Tesla valve is proposed to solve this problem. Firstly, the cooling effect is simulated and analyzed in the system with four different flow channel structures: semicircle, rectangle, triangle and Tesla valve. The results indicate that the system with the Tesla valve exhibits superior cooling performance. Subsequently, several factors including angle, valve number, valve type, and pipe diameter ratio for the Tesla valve are further studied through numerical and simulation analysis. The results reveal that Tesla valves demonstrate optimal cooling performance when possessing the following structural parameters: complete symmetry, more valves, a 30-degree angle and a pipe diameter ratio of 1. Finally, four different types of fluid are selected to explore the Tesla valve. The conclusion shows that nanofluids with high density, low specific heat, and high thermal conductivity also improve the cooling performance. Thus, the PV/T system with the Tesla valve exhibits good heat dissipation and energy storage efficiency, electrical efficiency can reach 16.32% and thermal efficiency reach 59.65%.
Introduction
Currently, fossil fuels are still the primary source of global energy consumption, comprising approximately 80% of the total global energy consumption1. Although fossil fuels play a crucial role in economic growth, social progress, and technological innovation, they lead to environmental pollution and even threaten people’s health. According to the International Energy Agency (IEA)2, Global CO2 emissions from energy combustion and industrial processes are 36.8 Gt in 2022. Therefore, it is quite beneficial to transition towards cleaner energy and improve energy efficiency. Solar energy presents a sustainable, low-cost, clean alternative compared to traditional fossil fuels3. With the development of technology, solar energy technology enjoys widespread popularity.
Photovoltaic (PV) technology, representing solar power generation, has reached an advanced stage of maturity4. Recent research shows that the maximum photoelectric transform efficiency can reach up to 31%5 by using silicon solar photovoltaic cells. However, the photoelectric transformation efficiency of photovoltaic cells cannot surpass 20% under standard conditions. The remaining energy is either absorbed by the photovoltaic cells or dissipated, resulting in significant energy loss. Additionally, a rise of 1 °C in surface temperature leads to a corresponding reduction in efficiency by 0.5%. Consequently, temperature emerges as a critical factor limiting the development of photovoltaic technology.
To address these challenges, researchers have combined photovoltaic cells with solar collector thermal technology. In the system, fluid within the thermal collector removes the thermal energy from the cells by cooling the PV. Thus, further research is focused on improving heat transfer and energy efficiency through variations in structure and fluid selection.
The cooling system uses fluid to realize the thermal energy transfer between PV panels and pipes while promoting heat dissipation and improving electric conversion efficiency6. The typical media include air7,8, water9,10 and nanofluids11,12,13. Water or air-based PV/T cooling systems offer low costs and allow for balanced energy distribution. However, the system is prone to freezing in low-temperature conditions, and there is still room for improvement in energy conversion efficiency. In contrast, nanofluid-based PV/T cooling systems exhibit higher heat transfer efficiency and can be transmitted through microchannels, which are not easy to freeze. Nonetheless, their higher cost remains a drawback.
Kern and Russell14 proposed solar photovoltaic solar thermal (PV/T) systems in 1978, and the technology was validated by experimental data using fluids such as air or water as the cooling medium. Chowdhury15 discussed the progress of PV/T systems cooled by air, water, and nanofluids and showed that PV/T systems would play a significant role in developing future renewable technologies. Kumar16 analyzed the PV/T air system and found that it produced a more substantial energy yield per unit area of the collector than a standalone battery or thermal system. Sarhaddi17 investigated the thermal and electrical performance of PV/T air collectors and revealed that increased inlet velocity and solar radiation intensity led to increased energy efficiency and thermal efficiency in the system. A Shahsavar18 studied the different PV/T air collector types with and without the cover plate. The PV/T system utilized thin metal sheets that improved heat extraction from PV panels, resulting in effective thermal and electrical efficiency. Fterich Mohamed19 analyzed heat transfer in a PV/T air collector prototype using numerical simulation and experimental study. The results indicated that with the best thermal efficiency of 42.5%, the temperature of the PV cell reached a maximum of 75 °C at an airflow rate of 0.5 m/s and 59 °C at an airflow rate of 2 m/s, with a maximum temperature difference of 20 °C between the two experiments. Ramdani Hamza20 presented a novel water-based hybrid PV/T collector design that utilized a layer of water to cool PV cells and filter incoming solar radiation. The study found that the proposed design outperforms previously proposed ones in terms of energy efficiency. Hassan Atazaz21 analyzed the influence of different parameters on PV/T water.
In recent years, nanofluids have received widespread attention owing to their outstanding thermal conductivity22,23,24. Studies have shown that nanofluids used in cooling PV/T systems can significantly enhance performance, as well as thermal and electrical efficiency. Currently, most research employs common nanofluids, such as Al2O3 and CuO. Sharaf25 analyzed the PV/T system using nanofluids. The results indicated that Al2O3H2O nanofluids were more advantageous than Al2O3 nanofluids in terms of thermal properties. Michael26 performed experiments on a rectangular PV/T system using CuO nanofluids and found that the system’s thermal performance was significantly enhanced. Venkatesh27 utilized water-based graphene nanofluids as the medium for heat transfer in the PV/T system. The results showed that the graphene nanofluid significantly reduced the PV panel temperature and improved the photovoltaic efficiency and overall efficiency.
The above discusses the influence of fluid on PV/T systems, however, the structural parameters of the flow channel can also have an important impact on PV/T systems. Shen28 designed a pipe with a shark dorsal fin type based on the theory of field synergy between velocity and temperature, thereby enhancing the heat transfer performance of the fluid. Kianifard29 designed a PV/T collector cooled by water using a serpentine semicircular pipe. The pipe connected the water directly to the heat-absorb plate. Singgih Dwi Prasetyo30 analyzed the electrical and thermal efficiency of the PV/T system by exploring different levels of radiation intensity, collector design, fluid type, and flow rate.
With the development of technology, the Tesla valve structure has attracted attention as a new fluid pipeline structure type31,32,33. Tesla valves can enhance heat transfer by creating vortices and turbulence in the fluid flow, which increases the heat transfer coefficient and reduces the temperature difference between the fluid and the solid surface. Some researchers have utilized numerical simulations or experiments to optimize the geometry, number of stages, angles, and tube diameters of Tesla valves, and improve the heat transfer performance. Jingyuan Qian34 conducted a numerical study on the Al2O3-water nanofluid based on the Tesla valve. Bohua Sun35 proposed the Tesla valve with a symmetric structure and analyzed fluid flow characteristics in the system using simulation and dimensional analysis. Wang36proposed the three-dimensional Tesla valve-typed structure and explored optimizing parameters using an annealing algorithm. Yiwei Fan37 proposed a battery thermal management system combining Multi-stage tesla valve liquid cooling and Phase change material. All of the above research applies the Tesla valve structure in heat transfer or heat dissipation with satisfactory feedback. However, the optimal design parameters for Tesla valves under different flow conditions and objectives still require additional exploration.
Thus, this paper aims to contribute by simulating and analyzing the PV/T system with four different flow channel structures and further investigating the optimal design parameters for Tesla valves. This study not only enhances the thermoelectric performance of the PV/T system but also serves as a reference for exploring research on Tesla valves in the field of heat dissipation.
All the parameters are explained in this section, as shown in Table 1.
Numerical analysis
Physical model design
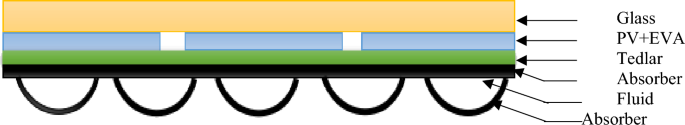
The study focuses on designing a solar PV/T system38, which includes glass, PV cells, a heat-absorbing plate, a flow channel, fluid, ethyl vinyl acetate (EVA) and TPT. The system is illustrated in Fig. 1.
Several metrics for the colding plate of circular, rectangular, triangular and Tesla valve channel types are shown in Fig. 2.
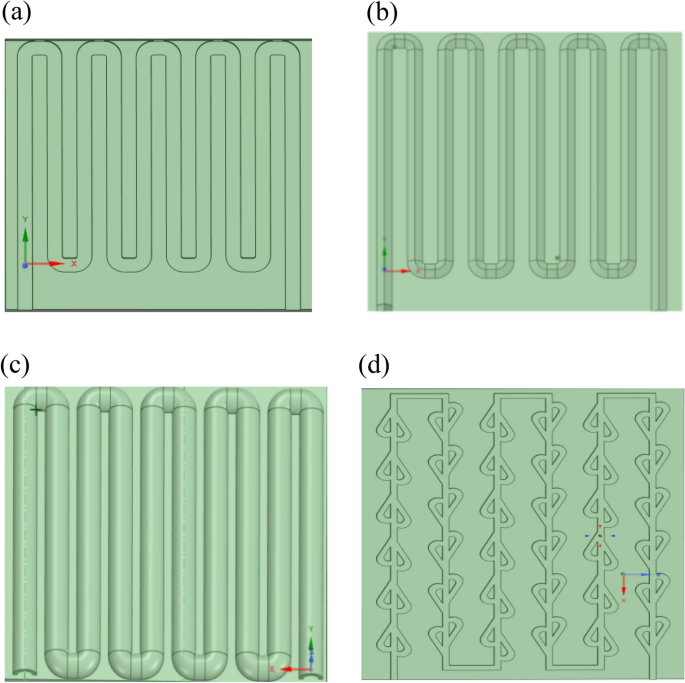
Schematic diagrams of different shapes of runner structures: (a) rectangle; (b) triangle; (c) semi-circle; (d) tesla valve.
The model parameters of the four runner structures are shown Table 2.
Model assumptions
The following premise and hypothesis are used:
-
The study assumes that only direct solar radiation reaches the surface of the collector. Radiations from the sky and glass cover are neglected.
-
Radiations between the cover plate and the heat-absorbing plate are neglected.
-
One-dimensional heat transfer takes place vertically through the PV panel.
-
The fluid within the airflow channel or water pipe is considered to be an incompressible Newtonian fluid.
-
Heat dissipation from the collector and bottom surface is not taken into consideration.
-
The fluid motion within the system is modeled as three-dimensional.
Control equation
The fluid is numerically calculated based on the flow equations governing mass conservation, energy conservation, and momentum conservation. The steady-state continuity20 equation is expressed by Eq. (1):
The momentum conservation equation is expressed by Eq. (2):
The energy conservation equation is expressed by Eq. (3):
Meshing strategy
The mesh size significantly influences simulation results. Refining the mesh brings simulation results closer to reality, but it also significantly increases the computational burden. Therefore, conducting mesh independence validation is essential for determining an appropriate mesh size. In this article, grid sizes ranging from 0.1 to 1 mm were selected, with temperature and chosen time factors as verification conditions to assess the suitability of the mesh size. The Tesla valve structure was employed for mesh-independent verification. The result is shown in Fig. 3.
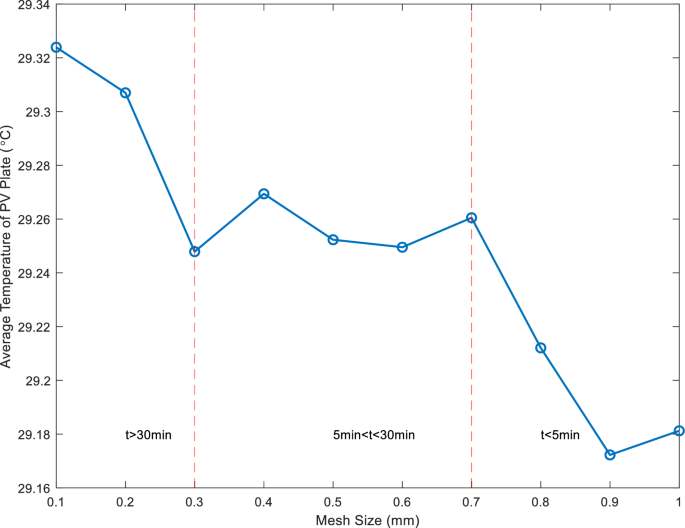
Grid independence verification.
Figure 3 demonstrates that using the grid element size between 0.3 and 0.7 mm yields get more stable results without requiring excessive simulation time, therefore, the mesh element size of 0.5 mm was selected for simulations in this study.
Numerical solution
ANSYS Student 2024 R1 (https://www.ansys.com/academic/students/ansys-student) software was used for the thermal simulation. ANSYS Student 2024 R1 was separated by finite volume algorithm and second order upwind scheme was chosen to momentum, continuity and energy equations. During the computation, residual parameters accurate to 10–6. SIMPLE algorithm was chosen to discretize Control equations. To make the simulation results more accurate, the DO radiation model is used, which has the property of solving the radiation problem for all optical depth ranges.
Temperature cloud map
The panel temperature distribution cloud diagrams under four different runner structures were explored through simulation, as shown below in Fig. 4:
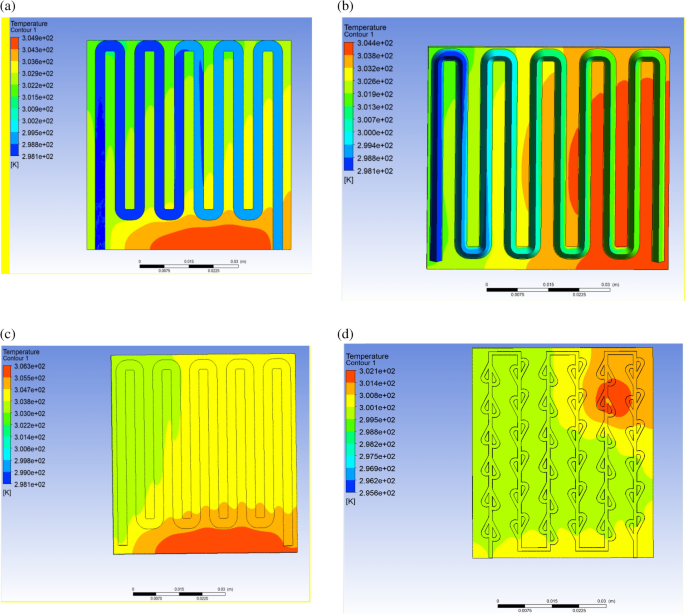
Temperature cloud map with different runner structures: (a) rectangle; (b) triangle; (c) semi-circle; (d) tesla valve.
Temperature cloud maps reflect the temperature distribution of the panels. As observed from the temperature cloud map, the cooling effect of the PV/T with Tesla valve structure on the panels is more ideal compared to other runner structures.
Evaluation performance
The system performance is mainly composed of electrical and thermal efficiency38; the performance evaluation is expressed by Eq. (4):
The electrical efficiency is expressed by Eq. (5):
The thermal efficiency is expressed by Eq. (6):
Analysis of results
Simulation analysis is conducted on the PV/T system with four different structures. The following parameters are utilized for the simulation: heat flux is 800 W/m2, atmospheric temperature is 298.15 K, convective heat transfer coefficient of 10W/m2K, and fluid medium is water with a temperature of 298.15 K. Then, the Re is calculated by Eq. (7):
Reynolds number (Re)35 is related to the viscosity, flow velocity, and the flow channel area. Keeping the tube diameter constant while the sufficiently high flow rate creates turbulence and then can enhance the cooling effect. Therefore, the k-ε model is adopted.
Cooling effects of four structures
The cooling effect of the Tesla valve is investigated by comparing it to the cooling effects of three different cross-sectional structures. Figure 5 below displays the comparing results.
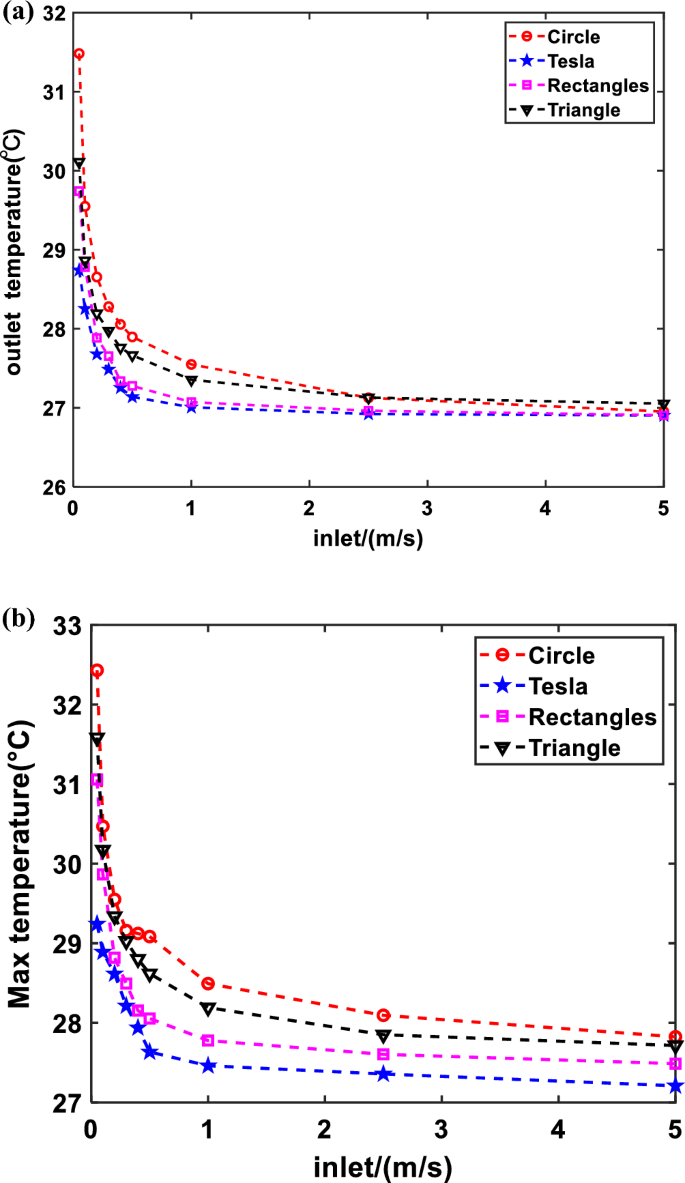
Relationship between fluid flow velocity and temperature for different flow channel structures: (a) fluid flow velocity and outlet fluid temperature; (b) fluid flow velocity and cell temperature.
As illustrated in Fig. 5, the cooling effect will be significantly affected by the speed increase. In particular, when the velocity lies within the range of the turbulent critical value to 1 m/s, the increase in flow velocity has a significant effect on lowering the PV temperature. However, when the flow velocity exceeded 1 m/s, there was no significant cooling effect with the increase in flow rate. When warm water is required, the fluid must be kept in the pipeline for a longer amount of time to allow for full heat exchange. This is accomplished by lowering the flow rate (laminar flow state) to create a more efficient heat source.
Indeed, increasing the water flow velocity reduces both the water and PV temperatures. At the same time, the outlet temperature decreases gradually with increasing velocity. As the fluid inlet flow rate increases, the time required for the fluid in the pipe to reach a turbulent state decreases. Consequently, the fluid absorbs less heat energy, leading to a lower outlet temperature. As with the outlet water temperature, the temperature of the PV decreases when velocity increases. The increase in fluid velocity causes a large amount of heat to be taken away as the fluid flows through the PV. While the fluid outlet temperature is decreasing per unit of time, the amount of water flowing out increases.
According to Fig. 5, it is evident that the outlet temperature of the flow channel structure of the Tesla valve is lower compared to the other three flow channel configurations. The superior performance of the forward Tesla valve can be attributed to the acceleration principle, which results in a higher exit velocity compared to the inlet velocity. When the inlet flow rate is constant, the fluid spends less time in the piping of the Tesla valve structure compared to other configurations, outlet temperature is even lower. Conversely, the flow rate through the Tesla valve pipe is greater during the same time, effectively removing more heat from the surface of the PV plate. This further substantiates the superior cooling effect of the Tesla valve structure.
The cooling effect is stable when the velocity exceeds 1 m/s, the outlet temperature and the PV panel temperature change slowly, and the thermoelectric efficiency is not significantly affected. Therefore, it is essential to prioritize the investigation of flow rates below 1 m/s when assessing thermoelectric efficiency.
It is necessary to evaluate the thermoelectric efficiency of the four structures. As shown in Fig. 6.
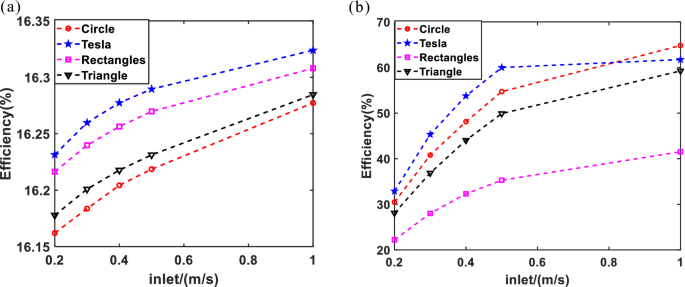
The thermoelectric efficiency of the four structures: (a) electrical efficiency; (b) thermal efficiency.
The cooling effect of the Tesla valve structure and thermoelectric efficiency have been analyzed based on Fig. 6. The results indicate that the cooling efficiency demonstrated by the Tesla valve is significantly higher, with electrical efficiency reaching 16.32% and thermal efficiency reaching 59.65%. However, various factors such as the angle, number, type, and diameter of the valve influence the cooling efficiency. Therefore, additional experimental studies are warranted.
Analysis of Tesla valve
Principle
The primary components of the structure consist of shunt length, shunt angle, radius of gyration, and shunt diameter39. As shown in Fig. 7.
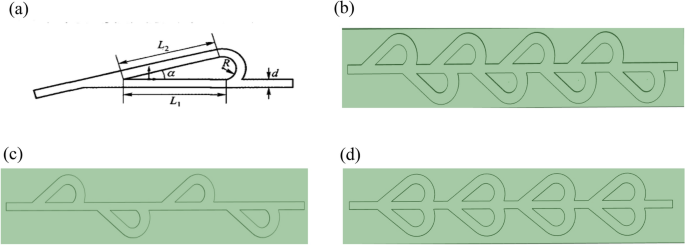
The tesla valve structure of different types: (a) the tesla valve structure; (b) non-symmetry; (c) asymmetries; (d) symmetry.
As illustrated above, the flow of liquid from the right to the left end is known as forward flow, while the flow from the left to the right is known as reverse flow. The bent form inside the valve causes the fluid to flow forward and reverse flow paths have different bending angles and distance traveled, which lead to different losses. Thus,Tesla valve performance is affected by parameters.
Parameter analysis and evaluation
The flow of fluid within a tube experiences energy loss and pressure reduction resulting from overcoming internal friction and turbulence generated by momentum exchange when fluid masses collide. The observed phenomenon is that the pressure is different in the fluid flow before and after, that is, the pressure drop. Thus, careful selection and evaluation of valve parameters is necessary. There are various evaluation indexes for Tesla valves, including pressure drop ratio and throttling efficiency40.
The pressure drop ratio is expressed by Eq. (9):
Throttling efficiency40 is defined by Eq. (10)
The pressure drop ratio and throttling efficiency have equivalence, thus, the pressure drop ratio was selected as the evaluation index in the study. In the turbulent flow state, the pressure drop35 can be expressed by Eq. (11):
For Newtonian fluids, the resistance coefficient can be expressed by Eq. (12):
Thus, based on formulas (7), (11) and (12), the expression for pressure drop versus velocity can be obtained by Eq. (13):
Therefore, the functional relationship can be obtained: (Delta P) ~ (V^{{frac{7}{{4}}}}).
Simulation analysis
Simulation analysis is necessary to determine the optimal parameters for the Tesla valve, considering factors such as valve type, pipe diameter ratio, angle, and valve numbers.
Velocity and pressure drop
As shown in Fig. 8a, the relationship between fluid flow velocity and pressure drop for different valve structures is analyzed, the results showed that the pressure drop in the symmetrical Tesla valve is smaller than the other two types. This is attributed to the division of flow through the valve into three channels, which subsequently converge into a single flow channel. However, the other valves only have two flow channels, forcing the fluid to circulate through the flow channel repeatedly. Hence, the pressure drop induced by each valve is relatively small, resulting in reduced differential pressure. According to the expression on the P ~ V, which can be used to fit a curve. it can be observed that the three types of Tesla valves exhibit conformity with the theoretical formula.
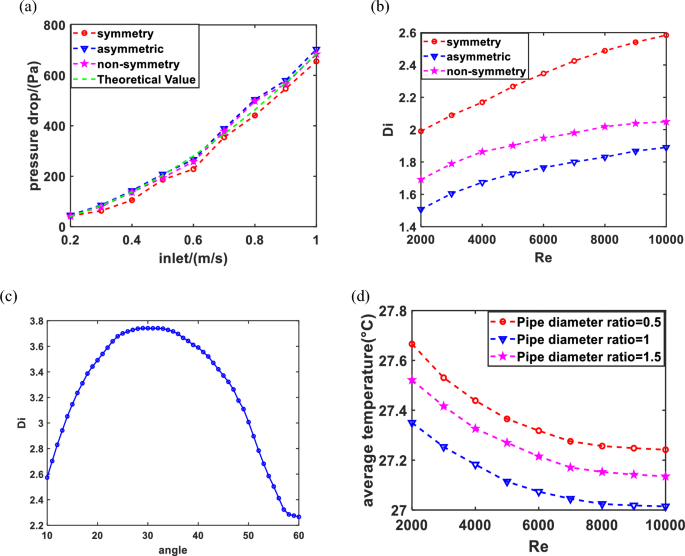
(a) Relationship between fluid flow velocity and pressure drop for different valve structures; (b) relationship between Re and pressure drop ratio for different valve structures; (c) relationship between different tube shunt angles and pressure drop ratio; (d) relationship between Re and average temperature for different pipe diameter ratios.
Different types
Figure 8b shows the pressure drop ratio of three different structures at Re numbers ranging from 2000 to 10,000. Although Re is the same, the fully symmetric valve structure has a significantly higher pressure drop ratio than the non-fully symmetric and fully asymmetric valves. The results suggest that the flow channel of the fully symmetric valve demonstrates superior flow characteristics.
Different shunt angles
With the increase of shunt angle, the pressure drop progressive increase, which subsequently leads to an improvement in the flow of the pipeline41. However, the valve angles excessively wide or small both hinder fluid flow, thereby compromising the overall performance of the pipeline. Consequently, the study establishes a range of diversion angles from 10° to 60° by empirical observations35 as shown in Fig. 8c. The pressure drop ratio achieves the maximum value when the angle is 30 degrees, indicating optimal operation of the system. Within the range of 10°–25°, with the increase of shunt angle, the pressure drop ratio increase. whereas the angles from 25° to 35°, the pressure drop ratio remains relatively stable and system performance is achieved optimal. However, the pressure drop ratio decreases once the angle surpasses 35 degrees, reducing system performance.
Pipe diameter
The diameter of the manifold pipe significantly affects the fluid flow; if the pipe diameter is too small, results in higher resistance loss in the system, while an excessively large diameter leads to slower flow rates of the manifold fluid. The parameters are typically set at d/D = 0.5, 1, 1.5, and three parameters for the variable to determine the appropriate pipe diameter ratio. The average temperature is used to evaluate the cooling effect of the Tesla valve in a friendly way. The results are shown in Fig. 8d; when the diameter ratio is within a certain range, the cooling effect of the PV is optimal. However, the fluid flow is slow and the cooling effect decreases as the diameter ratio increases. Therefore, the model chooses the diameter ratio of 1 as the optimal cooling parameter selection plan.
Valve number
The valve number can be expressed by Eq. (14):
In this research, the photovoltaic plate size is 600 × 90 mm, the pipe diameter is 10 mm and the diversion angle is 30 degrees. The inlet and outlet lengths are 20 mm, the valve length is 40 mm and the valve distance is greater than 20 mm.
Then, the PV average temperature at different Re is plotted in Fig. 9.
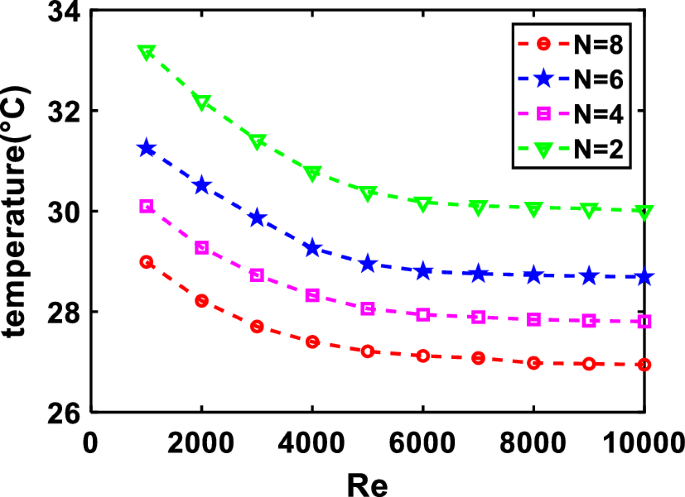
Relationship between Re and temperature for different valve numbers.
By analyzing, the relationship between Re and temperature can be obtained by Eq. (15):
Based on theoretical calculations, when the Re = 0, the max temperature should be presented. However, the fluid is stationary in this state; there is still convective heat transfer between the PV and fluid, which results in a decline in temperature. Therefore, the above formula does not consider the case where Re = 0.
According to the above analysis, the function is the logarithmic type and the parameter “a” varies around − 1. While “k” is directly proportional to N, as the number (N) increases, “k” also increases continuously. Simulation results show that the relationship between valve number, Reynolds number and the average PV temperature is deduced by Eq. (16):
According to Eqs. (14) and (16), The average temperature of the panel can be expressed as Eq. (17):
As shown in Fig. 9, increasing the valve numbers while keeping the Re constant results in a better cooling effect on PV temperature. The phenomenon occurs due to the increased contact area between the fluid and the solid, which generates more convective heat transfer. However, the cooling effect does not vary significantly when the Re increases and keeping the valve numbers constant. This observation indicates that the Re affects the cooling effect within a certain range.
In summary, this study analyzes the relationship between pressure drop and velocity is (Delta P) ~ (V^{{frac{7}{{4}}}}), in which the simulation is verified in three different types. Next, the study further explores the pressure drop ratio of Tesla valves with different structures and the symmetrical Tesla valve with a large pressure drop ratio and good stability is selected. Finally, the parameters that optimize the cooling effect are determined based on simulation analysis, which includes an angle of 30 degrees, a pipe diameter ratio of 1, as many valves as possible and N is taken as 8 in the model.
Cooling effect in different fluid
Nanofluids are known for excellent heat transfer properties42. The cooling effects of four fluids (Water, MgO, TiO2, and Al2O3) in the Tesla valve are analyzed in the study. The parameters shown in Table 3.
The results (Fig. 10) indicated that Nanofluids exhibits superior insulation and heat transfer properties as a working fluid. Nanofluids demonstrate better cooling effects than water under the same flow rate conditions. In contrast, nanofluids transfer heat more uniformly than water and result in a better cooling effect even at smaller flow rates. Because the density value and thermal conductivity of nanofluids are very high, which allows them to perform more efficient heat conversion. The temperature drop is smaller for water than nanofluids as a working fluid in the system. Therefore, nanofluids can achieve rapid cooling and heat storage.
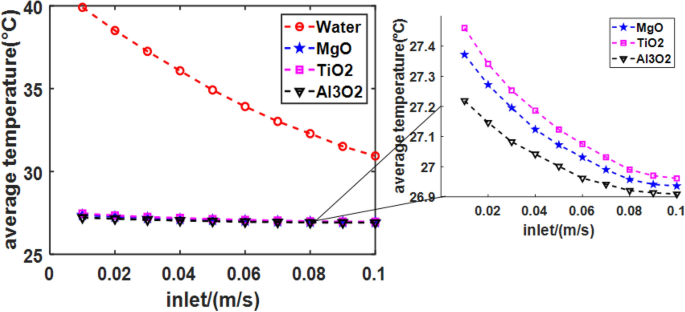
Relationship between inlet fluid flow velocity and average temperature for different fluids.
Comparison and discussion
Some comparisons between our conclusion and previous PV/T-related studies are list below, as shown in Table 4.
The efficiency is affected by different experimental conditions, such as solar radiation, collector type, environmental conditions, etc. The study chooses similar conditions for comparison as much as possible. The above comparisons show that all the schemes proposed have high thermoelectric efficiency in this study, which is due to the special structure of the Tesla valve flow channel, the positive direction can increase the fluid flow rate and lead to its electrical efficiency and thermal efficiency also reaches a relatively higher level.
Conclusion
In this paper, the flow channel structure of four different shape structures are compared by simulation analysis, and it is verified that the system with the Tesla valve structure flow channel has superior thermal and electrical efficiency. Several factors affecting the heat dissipation of the Tesla valve are investigated. The main results are presented as follows:
-
1.
the cooling efficiency of the PV/T system with the Tesla valve is superior, electrical efficiency can reach 16.32% and thermal efficiency reach 59.65%.
-
2.
the optimized parameters of the Tesla valve are determined based on simulation analysis, which includes an angle of 30°, a pipe diameter ratio of 1, as many valves as possible and N is taken as 8 in this model, which performs a superior cooling result.
-
3.
Nanofluids have the potential to achieve rapid cooling and heat storage.
In summary, this paper proposes the PV/T with Tesla valve has a significant effect on improving thermoelectric efficiency. The excellent performance of Tesla valve heat dissipation is illustrated, and the PV/T system based on different runner structures and different working conditions can be further investigated in the future, and further experiments can be conducted based on the simulation results. Meanwhile, the Tesla valve structure in this study can also be applied to other heat exchange fields, such as the miniature heat dissipation system of cell phones, aerospace and other fields.
Data availability
Data will be made available on request. Ping Zhong (pz*******@dh*.cn) should be contacted if you want to request the data from this study.
References
-
EIA, 2020 Global Status Report for Buildings and Construction (Global Status Report, 2019).
-
International energy agency, CO2 Emissions in 2022. [Online]. Available: www.iea.org (2022).
-
Zhang, H., Feng, C. & Zhou, X. Going carbon-neutral in China: Does the low-carbon city pilot policy improve carbon emission efficiency?. Sustain Prod. Consum. 33, 1. https://doi.org/10.1016/j.spc.2022.07.002 (2022).
-
Zondag, H. A. et al. Photovoltaic/thermal solar. Solar Energy 5, 1 (2019).
-
Ahmed, O. K. & Mohammed, Z. A. Influence of porous media on the performance of hybrid PV/Thermal collector. Renew. Energy 112, 1. https://doi.org/10.1016/j.renene.2017.05.061 (2017).
-
Naghdbishi, A., Yazdi, M. E. & Akbari, G. Experimental investigation of the effect of multi-wall carbon nanotube—Water/glycol based nanofluids on a PVT system integrated with PCM-covered collector. Appl. Therm. Eng 178, 1. https://doi.org/10.1016/j.applthermaleng.2020.115556 (2020).
-
Kamthania, D., Nayak, S. & Tiwari, G. N. Performance evaluation of a hybrid photovoltaic thermal double pass facade for space heating. Energy Build. 43, 9. https://doi.org/10.1016/j.enbuild.2011.05.007 (2011).
-
Rukman, N. S. B. et al. Electrical and thermal efficiency of air-based photovoltaic thermal (PVT) systems: An overview. Indones. J. Electr. Eng. Comput. Sci. 14, 3. https://doi.org/10.11591/ijeecs.v14.i3.pp1134-1140 (2019).
-
Ji, J., Lu, J. P., Chow, T. T., He, W. & Pei, G. A sensitivity study of a hybrid photovoltaic/thermal water-heating system with natural circulation. Appl. Energy 84, 2. https://doi.org/10.1016/j.apenergy.2006.04.009 (2007).
-
Xu, L. et al. A hybrid PV thermal (water or air) wall system integrated with double air channel and phase change material: A continuous full-day seasonal experimental research. Renew. Energy 173, 1. https://doi.org/10.1016/j.renene.2021.04.008 (2021).
-
Al-Waeli, A. H. A. et al. Evaluation of the nanofluid and nano-PCM based photovoltaic thermal (PVT) system: An experimental study. Energy Convers. Manag. 151, 1. https://doi.org/10.1016/j.enconman.2017.09.032 (2017).
-
Shahsavar, A., Jha, P., Arıcı, M. & Estellé, P. Experimental investigation of the usability of the rifled serpentine tube to improve energy and energy performances of a nanofluid-based photovoltaic/thermal system. Renew. Energy 170, 1. https://doi.org/10.1016/j.renene.2021.01.117 (2021).
-
Sardarabadi, M., Passandideh-Fard, M., Maghrebi, M. J. & Ghazikhani, M. Experimental study of using both ZnO/ water nanofluid and phase change material (PCM) in photovoltaic thermal systems. Solar Energy Mater. Solar Cells 161, 1. https://doi.org/10.1016/j.solmat.2016.11.032 (2017).
-
Kern, E. C., & Russell, M. C. Combined photovoltaic and thermal hybrid collector systems. In Conference Record of the IEEE Photovoltaic Specialists Conference (1978).
-
Chowdhury, S., & Chowdhury, M. R. Advancements of air, water and nanofluid based photovoltaic thermal (PV/T) technologies. In 2nd International Conference on Electrical and Electronic Engineering, ICEEE 2017. https://doi.org/10.1109/CEEE.2017.8412852 (2017).
-
Kumar, R. & Rosen, M. A. A critical review of photovoltaic-thermal solar collectors for air heating. Appl. Energy 88, 11. https://doi.org/10.1016/j.apenergy.2011.04.044 (2011).
-
An improved thermal and electrical model for a solar photovoltaic thermal (PV/T) air collector.
-
Shahsavar, A., Salmanzadeh, M., Ameri, M. & Talebizadeh, P. Energy saving in buildings by using the exhaust and ventilation air for cooling of photovoltaic panels. Energy Build. 43, 9. https://doi.org/10.1016/j.enbuild.2011.05.003 (2011).
-
Fterich, M. et al. Numerical simulation and experimental characterization of the heat transfer in a PV/T air collector prototype. Case Stud. Thermal Eng. 27, 1. https://doi.org/10.1016/j.csite.2021.101209 (2021).
-
Ramdani, H. & Ould-Lahoucine, C. Study on the overall energy and exergy performances of a novel water-based hybrid photovoltaic-thermal solar collector. Energy Convers. Manag. 222, 1. https://doi.org/10.1016/j.enconman.2020.113238 (2020).
-
Hassan, A. et al. An experimental and numerical study on the impact of various parameters in improving the heat transfer performance characteristics of a water based photovoltaic thermal system. Renew. Energy 202, 1. https://doi.org/10.1016/j.renene.2022.11.087 (2023).
-
Yousefi, T., Veysi, F., Shojaeizadeh, E. & Zinadini, S. An experimental investigation on the effect of Al2O3-H2O nanofluid on the efficiency of flat-plate solar collectors. Renew Energy 39, 1. https://doi.org/10.1016/j.renene.2011.08.056 (2012).
-
Hossain, F., Karim, M. R. & Bhuiyan, A. A. A review on recent advancements of the usage of nano fluid in hybrid photovoltaic/thermal (PV/T) solar systems. Renew. Energy 188, 1. https://doi.org/10.1016/j.renene.2022.01.116 (2022).
-
Behzadi, A. & Arabkoohsar, A. Feasibility study of a smart building energy system comprising solar PV/T panels and a heat storage unit. Energy 210, 1. https://doi.org/10.1016/j.energy.2020.118528 (2020).
-
Sharaf, O. Z. & Orhan, M. F. Thermodynamic analysis and optimization of densely-packed receiver assembly components in high-concentration CPVT solar collectors. Energy Convers. Manag. 121, 1. https://doi.org/10.1016/j.enconman.2016.05.012 (2016).
-
Michael, J. J. & Iniyan, S. Performance analysis of a copper sheet laminated photovoltaic thermal collector using copper oxide – water nanofluid. Solar Energy 119, 439–451. https://doi.org/10.1016/j.solener.2015.06.028 (2015).
-
Venkatesh, T., Manikandan, S., Selvam, C. & Harish, S. Performance enhancement of hybrid solar PV/T system with graphene based nanofluids. Int. Commun. Heat Mass Transfer 130, 105. https://doi.org/10.1016/j.icheatmasstransfer.2021.105794 (2022).
-
Shen, C. et al. A numerical investigation on optimization of PV/T systems with the field synergy theory. Appl. Therm. Eng. 185, 1. https://doi.org/10.1016/j.applthermaleng.2020.116381 (2021).
-
Kianifard, S., Zamen, M. & Nejad, A. A. Modeling, designing and fabrication of a novel PV/T cooling system using half pipe. J. Clean. Prod. 253, 1. https://doi.org/10.1016/j.jclepro.2020.119972 (2020).
-
Prasetyo, S. D., Prabowo, A. R. & Arifin, Z. The use of a hybrid photovoltaic/thermal (PV/T) collector system as a sustainable energy-harvest instrument in urban technology. Heliyon 9, 2. https://doi.org/10.1016/j.heliyon.2023.e13390 (2023).
-
Wang, C. T., Chen, Y. M., Hong, P. A. & Wang, Y. T. Tesla valves in Micromixers. Int. J. Chem. React. Eng. 12(1), 1. https://doi.org/10.1515/ijcre-2013-0106 (2014).
-
Jiang Jin, Z., Xin Gao, Z., Rui Chen, M. & Yuan Qian, J. Parametric study on Tesla valve with reverse flow for hydrogen decompression. Int. J. Hydrogen Energy 43, 18. https://doi.org/10.1016/j.ijhydene.2018.03.014 (2018).
-
de Vries, S. F., Florea, D., Homburg, F. G. A. & Frijns, A. J. H. Design and operation of a Tesla-type valve for pulsating heat pipes. Int. J. Heat Mass Transf. 105, 1. https://doi.org/10.1016/j.ijheatmasstransfer.2016.09.062 (2017).
-
Yuan Qian, J., Yi Wu, J., Xin Gao, Z., Wu, A. & Jiang Jin, Z. Hydrogen decompression analysis by multi-stage Tesla valves for hydrogen fuel cell. Int. J. Hydrogen Energy 44, 26. https://doi.org/10.1016/j.ijhydene.2019.03.235 (2019).
-
Liu, Z., Shao, W. Q., Sun, Y. & Sun, B. H. Scaling law of the one-direction flow characteristics of symmetric Tesla valve. Eng. Appl. Comput. Fluid Mech. 16, 1. https://doi.org/10.1080/19942060.2021.2023648 (2022).
-
Wang, H. & Chen, X. Optimization of tesla valve-typed micromixer based on simulated annealing algorithm. Surf. Rev. Lett. 29, 7. https://doi.org/10.1142/S0218625X22500949 (2022).
-
Fan, Y. et al. Novel concept design of low energy hybrid battery thermal management system using PCM and multistage Tesla valve liquid cooling. Appl. Therm. Eng. 220, 1. https://doi.org/10.1016/j.applthermaleng.2022.119680 (2023).
-
El Fouas, C., Hajji, B., Gagliano, A., Tina, G. M. & Aneli, S. Numerical model and experimental validation of the electrical and thermal performances of photovoltaic/thermal plant. Energy Convers Manag. 220, 1. https://doi.org/10.1016/j.enconman.2020.112939 (2020).
-
Truong, T. Q., & Nguyen, N. T. Simulation and optimization of Tesla valves. In 2003 Nanotechnology Conference and Trade Show—Nanotech 2003 (2003).
-
Nguyen, Q. M., Abouezzi, J. & Ristroph, L. Early turbulence and pulsatile flows enhance diodicity of Tesla’s macrofluidic valve. Nat. Commun. 12, 1. https://doi.org/10.1038/s41467-021-23009-y (2021).
-
Hu, P. et al. Numerical investigation of Tesla valves with a variable angle. Phys. Fluids 34(3), 1. https://doi.org/10.1063/5.0084194 (2022).
-
Al-Shamani, A. N. et al. Experimental studies of rectangular tube absorber photovoltaic thermal collector with various types of nanofluids under the tropical climate conditions. Energy Convers. Manag. 124, 528. https://doi.org/10.1016/j.enconman.2016.07.052 (2016).
-
Widyolar, B. et al. Experimental performance of an ultra-low-cost solar photovoltaic-thermal (PVT) collector using aluminum minichannels and nonimaging optics. Appl. Energy 268, 1. https://doi.org/10.1016/j.apenergy.2020.114894 (2020).
-
Karaaslan, I. & Menlik, T. Numerical study of a photovoltaic thermal (PV/T) system using mono and hybrid nanofluid. Solar Energy 224, 1260. https://doi.org/10.1016/j.solener.2021.06.072 (2021).
-
Huo, Y. et al. Experimental study on the tube plate PV/T system with iron filings filled. Solar Energy 185, 189. https://doi.org/10.1016/j.solener.2019.04.041 (2019).
-
Pang, W. et al. Cross sectional geometries effect on the energy efficiency of a photovoltaic thermal module: Numerical simulation and experimental validation. Energy 209, 1. https://doi.org/10.1016/j.energy.2020.118439 (2020).
Acknowledgements
This work was supported by the National Natural Science Foundation of China (51975116), Natural Science Foundation of Shanghai (21ZR1402900).
Author information
Authors and Affiliations
Contributions
Shuai Du: conceptualization, software, formal analysis, methodology, investigation, roles/writing—original draft, writing—review and editing. Jianxin Zou: conceptualization, software, data curation, formal analysis, methodology, roles/writing—original draft, writing—review and editing. Xinli Zheng: investigation, data curation, software, resources. Xin Ye: investigation, data curation, software, formal analysis. Huazheng Yang: investigation, data curation. Ping Zhong: project administration, funding acquisition, resources, supervision, validation, visualization, writing—review and editing.
Corresponding author
Ethics declarations
Competing interests
The authors declare no competing interests.
Additional information
Publisher’s note
Springer Nature remains neutral with regard to jurisdictional claims in published maps and institutional affiliations.
Rights and permissions
Open Access This article is licensed under a Creative Commons Attribution 4.0 International License, which permits use, sharing, adaptation, distribution and reproduction in any medium or format, as long as you give appropriate credit to the original author(s) and the source, provide a link to the Creative Commons licence, and indicate if changes were made. The images or other third party material in this article are included in the article’s Creative Commons licence, unless indicated otherwise in a credit line to the material. If material is not included in the article’s Creative Commons licence and your intended use is not permitted by statutory regulation or exceeds the permitted use, you will need to obtain permission directly from the copyright holder. To view a copy of this licence, visit http://creativecommons.org/licenses/by/4.0/.
About this article
Cite this article
Du, S., Zou, J., Zheng, X. et al. Numerical study on solar photovoltaic/thermal system with tesla valve.
Sci Rep 14, 10836 (2024). https://doi.org/10.1038/s41598-024-61785-x
-
Received: 01 March 2024
-
Accepted: 09 May 2024
-
Published: 12 May 2024
-
DOI: https://doi.org/10.1038/s41598-024-61785-x
Keywords
Comments
By submitting a comment you agree to abide by our Terms and Community Guidelines. If you find something abusive or that does not comply with our terms or guidelines please flag it as inappropriate.