
Ranked: Best And Worst States For Solar 2024 – Forbes Home – Forbes
To assess the best and worst states for solar energy as well as what solar incentives are available nationwide, we analyzed six factors:
- Megawatts of solar installed per state
- How many solar jobs are available
- Number of homes powered by solar
- Percentage of energy run by solar
- How many clear days each state averages per year
- The average cost of installation after the federal solar tax incentive
These metrics allowed us to evaluate states’ solar sophistication, states with solid solar job markets and more. Based on this analysis, it’s clear which states are the best and worst for solar energy. It’s worth noting, however, that the majority of states are somewhere in the middle—which suggests there is a strong possibility for more solar energy development throughout the country.
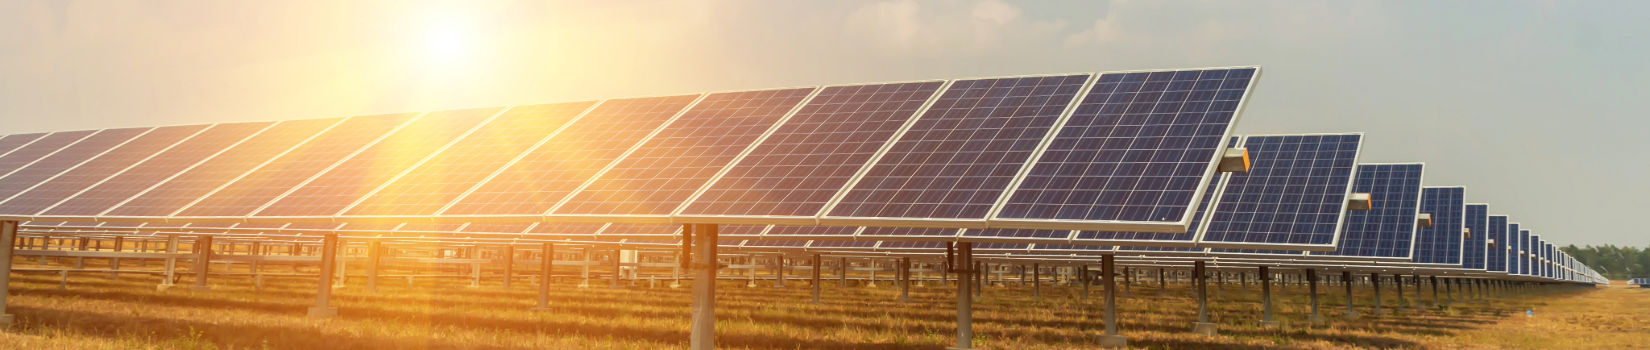
The Best State for Solar Energy
California tops the list when it comes to solar energy friendliness. With nearly 150 sunny days per year along with an already robust solar system, job market and investments into the solar space, California is an ideal state for installing solar panels.
Many other states are trending in positive directions when it comes to utilizing and supporting more solar energy. For instance, Arizona is the sunniest state in the country and is closing in on one million homes powered by solar.
The Worst State for Solar Energy
North Dakota ranks worst for solar energy. Although North Dakota’s climate is relatively conducive to solar energy, there are only two megawatts of total solar installation in the state. That impacts the overall solar job market and doesn’t contribute any clean, solar electricity to the grid.
Solar energy is underutilized in many other states that are actually solid contenders for solar panels. For example, Kansas ranks 44th on the list of best states for solar. However, the Sunflower State has an impressive 128 sunny days per year and solar panels cost an average of $9,881 to install there, which is well below the national average. Yet only 0.02% of the state’s energy is powered by solar with just 110 MW of solar installed.
The States With the Most and Least Solar Sophistication
California has the most megawatts of solar currently installed, coming in at 38,145 MW. This powers 27.3% of all energy in the state. Nevada and Hawaii both have large percentages of solar power utilization.
North Dakota falls last on the solar sophistication scale with only two megawatts of solar installation powering 145 homes and an average of 0% of the state’s energy. South Dakota and West Virginia are not far behind, with both of those states failing to contribute any measurable solar energy to the state’s energy supply.
States With Thriving Solar Job Markets
Although California is by far the best solar job market with a total of 75,712 solar jobs, Florida, Massachusetts, New York and Texas have also created thousands of jobs due to their solar implementation, according to the U.S. Bureau of Labor Statistics. Such jobs include more than solar installers and range from chemists and engineers to conductors and power plant operators and everything in between.
This data came from the SEIA and the Bureau of Labor Statistics.
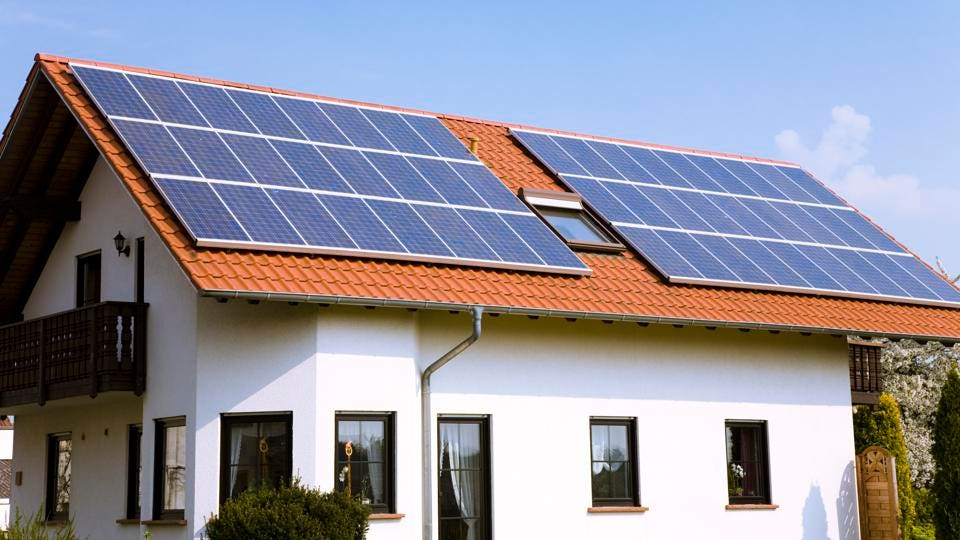
States With the Most and Least Number of Homes Powered by Solar
Once again, California tops the list with 10,510,648 homes currently powered primarily by solar, which is not surprising when you take into account that California is also the most populous state. In terms of homes powered by solar energy, California is followed by Texas, Florida, North Carolina and Arizona.
North Dakota rounds out the bottom of the list with 149 solar-powered homes. Although that can be attributed partially to the state’s relatively low overall population, similarly low-populated states like Wyoming and Vermont both have significantly more homes powered by solar energy. North Dakota is accompanied at the bottom by South Dakota, Alaska, West Virginia and Kentucky.