

This insight was contributed by Tigo Energy.
During the April 8 solar eclipse, parts of North America experienced up to four minutes of totality. While people were flocking to the path of totality to catch several minutes of total darkness mid-day, Tigo turned to its Energy Intelligence Portal to watch the impact a few minutes of night-like conditions would have on solar production at homes and businesses across the country.
Solar monitoring data during a solar eclipse provides a unique opportunity to gather real-world insights into solar energy production. This year, Tigo polled multiple sites from different states along the path of totality to see how the eclipse would affect solar production.
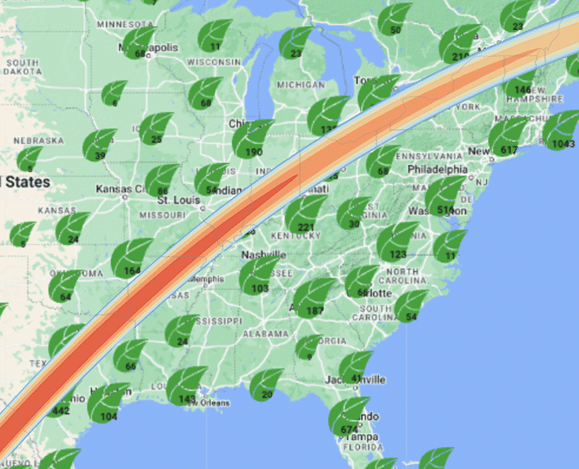
The map atop the page is Tigo Energy’s monitored installations. Each leaf represents clusters of installations that are monitored by Tigo technology at the solar module level. Below is a map of the installations that fall under and near the path of totality, starting in Texas and rising to the northeast.
Since Tigo has some of the most granular monitoring data in the industry – at 60-second intervals – the four minutes of totality, or partial totality in other places, clearly showed the true drop in production and rapid rebound. Below are six sites in the path of totality.
Starting in the southernmost state within the path of totality, a residential installation in Round Rock, Texas, saw solar peaking at about 9kW right before the eclipse, then rapid dip to zero production, and rebounding minutes later. The spikes leading up to the eclipse are from clouds casting shade over the array.
In Arkansas, where the skies were clearer than in Texas, a solar system experienced a much smoother graph, as well as a much steeper drop in production around 1 pm.
As totality approached Indiana, a system showed high production until the sun was blocked completely. The light green stack in this graph shows how Tigo optimization technology produced incrementally more energy as night fell for a few minutes and ramped up as the afternoon sun returned.
This site in Ohio also fell in the path of totality.
This Tigo site, on the path of totality in New York, experienced the drastic and immediate change brought on by the eclipse. The site went into darkness around 3:00 pm, although production was not at its peak due to cloud coverage in the area.
Finally, a site in Vermont saw a significant dip in production from the eclipse after clouds obscured clear skies earlier in the day.

This gradient map of cloud coverage at the time of the eclipse shows that the further north-east a location was, the heavier the cloud coverage was.

Tigo Energy’s data collection during the 2024 eclipse highlights the module-level solar monitoring made possible by the combination of Tigo TS4-A-O MLPE devices and the EI software monitoring system. By tracking performance in real-time, solar energy providers can optimize system performance and identify potential issues with solar panels or inverters to maximize energy production, making solar power more robust and reliable.
Listen to more in-depth conversations on Solar Builder’s YouTube channel

Our most popular series include:
Power Forward! | A collaboration with BayWa r.e. to discuss higher level industry topics.
The Buzz | Where we give our 2 cents per kWh on the residential solar market.
The Pitch | Discussions with solar manufacturers about their new technology and ideas.
Tags: Tigo Energy
This post was originally published on 3rd party site mentioned in the title of this site
